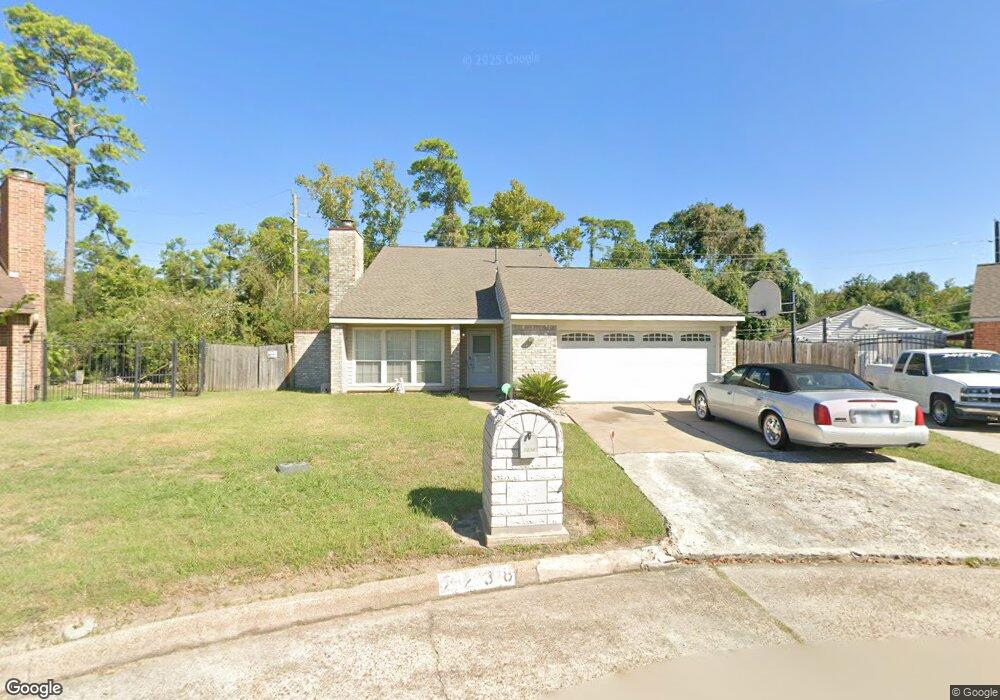
7238 Wind Trail St Houston, TX 77040
Brookhollow West NeighborhoodEstimated Value: $293,054 - $352,000
3
Beds
3
Baths
2,085
Sq Ft
$151/Sq Ft
Est. Value
About This Home
This home is located at 7238 Wind Trail St, Houston, TX 77040 and is currently estimated at $314,764, approximately $150 per square foot. 7238 Wind Trail St is a home located in Harris County with nearby schools including Gleason Elementary School, Cook Middle School, and Jersey Village High School.
Ownership History
Date
Name
Owned For
Owner Type
Purchase Details
Closed on
Aug 4, 2004
Sold by
Owen Tracy R and Owen Cheryl L
Bought by
Noble Kerry L and Noble Edna S
Current Estimated Value
Home Financials for this Owner
Home Financials are based on the most recent Mortgage that was taken out on this home.
Original Mortgage
$116,082
Outstanding Balance
$58,250
Interest Rate
6.18%
Mortgage Type
FHA
Estimated Equity
$256,514
Purchase Details
Closed on
Jun 27, 1998
Sold by
Dorrell Sandra H
Bought by
Owen Tracy R and Owen Cheryl L
Home Financials for this Owner
Home Financials are based on the most recent Mortgage that was taken out on this home.
Original Mortgage
$89,200
Interest Rate
7.13%
Purchase Details
Closed on
Sep 25, 1996
Sold by
Higgins Linda Sue and Proctor Linda Sue Higgins
Bought by
Dorrell Sandra Gail Higgins
Create a Home Valuation Report for This Property
The Home Valuation Report is an in-depth analysis detailing your home's value as well as a comparison with similar homes in the area
Home Values in the Area
Average Home Value in this Area
Purchase History
| Date | Buyer | Sale Price | Title Company |
|---|---|---|---|
| Noble Kerry L | -- | Startex Title Company | |
| Owen Tracy R | -- | Stewart Title | |
| Dorrell Sandra Gail Higgins | -- | -- |
Source: Public Records
Mortgage History
| Date | Status | Borrower | Loan Amount |
|---|---|---|---|
| Open | Noble Kerry L | $116,082 | |
| Previous Owner | Owen Tracy R | $89,200 |
Source: Public Records
Tax History Compared to Growth
Tax History
| Year | Tax Paid | Tax Assessment Tax Assessment Total Assessment is a certain percentage of the fair market value that is determined by local assessors to be the total taxable value of land and additions on the property. | Land | Improvement |
|---|---|---|---|---|
| 2025 | $54 | $265,678 | $76,274 | $189,404 |
| 2024 | $54 | $257,333 | $69,160 | $188,173 |
| 2023 | $54 | $264,158 | $69,160 | $194,998 |
| 2022 | $3,826 | $231,324 | $57,699 | $173,625 |
| 2021 | $3,659 | $186,547 | $57,699 | $128,848 |
| 2020 | $3,427 | $159,069 | $48,214 | $110,855 |
| 2019 | $3,509 | $157,014 | $16,598 | $140,416 |
| 2018 | $749 | $142,678 | $16,598 | $126,080 |
| 2017 | $3,191 | $142,678 | $16,598 | $126,080 |
| 2016 | $3,191 | $142,678 | $16,598 | $126,080 |
| 2015 | $877 | $139,514 | $16,598 | $122,916 |
| 2014 | $877 | $122,184 | $13,832 | $108,352 |
Source: Public Records
Map
Nearby Homes
- 7714 Rolling Fork Ln
- 9427 Fern Wood Forest
- 9118 Woodwind Lakes Dr
- 9114 Brahms Ln
- 8710 Congo Ln
- 9315 Woodwind Lakes Dr
- 7818 Stoneyway Dr
- 7824 Stoneyway Dr
- 8715 Andante Dr
- 7903 Bachwood Dr
- 7926 Stoneyway Dr
- 7947 Clarion Way
- 8817 Emmott Rd
- 7802 Percussion Place
- 8111 Ivan Reid Dr
- 7926 Windy Creek Dr
- 8026 Clarion Way
- 8126 Ivan Reid Dr
- 9430 Oratorio Ct
- 7605 Fairbanks North Houston Rd
- 7234 Wind Trail St
- 7235 Wind Trail St
- 7230 Wind Trail St
- 7231 Wind Trail St
- 7231 Wind Dale St
- 7226 Wind Trail St
- 7227 Wind Dale St
- 7227 Wind Trail St
- 7223 Wind Trail St
- 7222 Wind Trail St
- 7223 Wind Dale St
- 7234 Wind Dale St
- 7219 Wind Dale St
- 7218 Wind Trail St
- 7219 Wind Trail St
- 7230 Wind Dale St
- 7215 Wind Dale St
- 7226 Wind Dale St
- 7214 Wind Trail St
- 7222 Wind Dale St