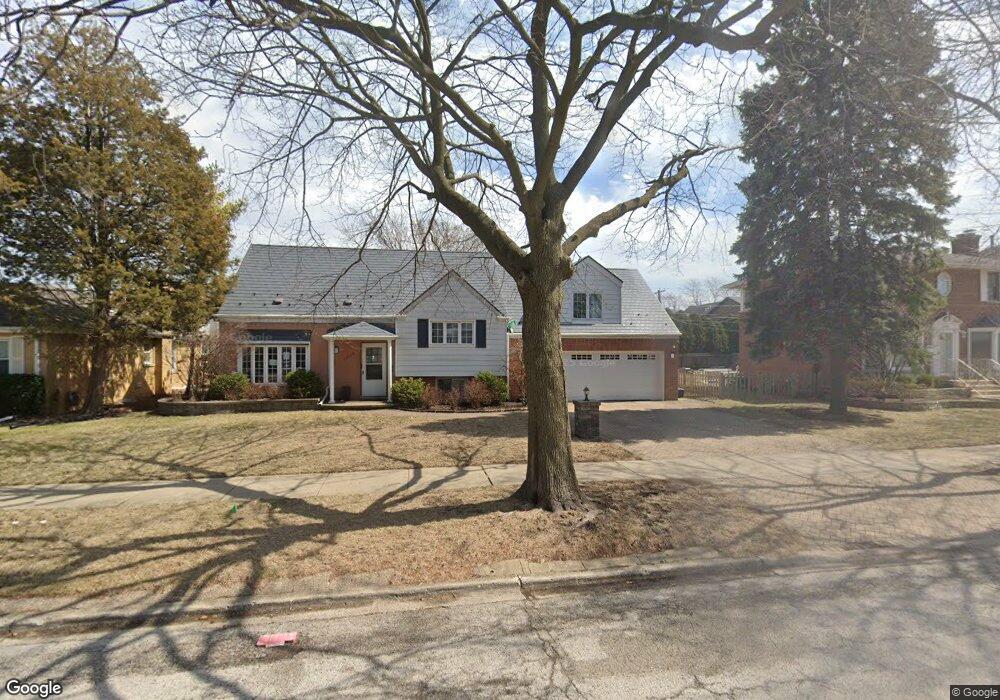
7239 N Keeler Ave Lincolnwood, IL 60712
Estimated Value: $626,000 - $780,000
4
Beds
3
Baths
2,476
Sq Ft
$280/Sq Ft
Est. Value
About This Home
This home is located at 7239 N Keeler Ave, Lincolnwood, IL 60712 and is currently estimated at $693,080, approximately $279 per square foot. 7239 N Keeler Ave is a home located in Cook County with nearby schools including Todd Hall Elementary School, Rutledge Hall Elementary School, and Lincoln Hall Middle School.
Ownership History
Date
Name
Owned For
Owner Type
Purchase Details
Closed on
Sep 25, 2025
Sold by
Shao Thomas and Shao Patricia
Bought by
Thomas Shao And Patricia Wong Shao Living Tru and Shao
Current Estimated Value
Purchase Details
Closed on
Feb 17, 2012
Sold by
Shao Thomas and Shao Patricia
Bought by
Shao Thomas and Shao Patricia
Home Financials for this Owner
Home Financials are based on the most recent Mortgage that was taken out on this home.
Original Mortgage
$234,000
Interest Rate
2.62%
Mortgage Type
New Conventional
Purchase Details
Closed on
Dec 15, 1998
Sold by
Kondiles Milton N and Kondiles Kathleen A
Bought by
Shao Thomas and Louie Patricia W
Home Financials for this Owner
Home Financials are based on the most recent Mortgage that was taken out on this home.
Original Mortgage
$305,000
Interest Rate
6.94%
Create a Home Valuation Report for This Property
The Home Valuation Report is an in-depth analysis detailing your home's value as well as a comparison with similar homes in the area
Home Values in the Area
Average Home Value in this Area
Purchase History
| Date | Buyer | Sale Price | Title Company |
|---|---|---|---|
| Thomas Shao And Patricia Wong Shao Living Tru | -- | None Listed On Document | |
| Shao Thomas | -- | None Available | |
| Shao Thomas | $339,000 | Professional National Title |
Source: Public Records
Mortgage History
| Date | Status | Borrower | Loan Amount |
|---|---|---|---|
| Previous Owner | Shao Thomas | $234,000 | |
| Previous Owner | Shao Thomas | $305,000 |
Source: Public Records
Tax History Compared to Growth
Tax History
| Year | Tax Paid | Tax Assessment Tax Assessment Total Assessment is a certain percentage of the fair market value that is determined by local assessors to be the total taxable value of land and additions on the property. | Land | Improvement |
|---|---|---|---|---|
| 2024 | $13,553 | $54,000 | $13,755 | $40,245 |
| 2023 | $12,991 | $54,000 | $13,755 | $40,245 |
| 2022 | $12,991 | $54,000 | $13,755 | $40,245 |
| 2021 | $11,011 | $41,285 | $9,825 | $31,460 |
| 2020 | $12,506 | $41,285 | $9,825 | $31,460 |
| 2019 | $10,981 | $45,873 | $9,825 | $36,048 |
| 2018 | $12,506 | $49,522 | $8,596 | $40,926 |
| 2017 | $12,574 | $49,522 | $8,596 | $40,926 |
| 2016 | $12,181 | $49,522 | $8,596 | $40,926 |
| 2015 | $10,229 | $39,177 | $7,368 | $31,809 |
| 2014 | $9,830 | $39,177 | $7,368 | $31,809 |
| 2013 | $9,594 | $39,177 | $7,368 | $31,809 |
Source: Public Records
Map
Nearby Homes
- 7230 N Keeler Ave
- 7226 N Kildare Ave
- 7412 Keeler Ave
- 7427 Tripp Ave
- 4021 W Estes Ave
- 7245 N Kostner Ave
- 7424 Crawford Ave
- 7225 N East Prairie Rd
- 7201 N Lincoln Ave Unit 308
- 7201 N Lincoln Ave Unit 301
- 3846 W Touhy Ave
- 3924 W Greenleaf Ave
- 3832 W Chase Ave
- 6936 N Keystone Ave
- 3836 W Estes Ave
- 3814 W Sherwin Ave
- 7330 N Kilbourn Ave
- 3819 W Greenleaf Ave
- 4545 W Touhy Ave Unit 511
- 4545 W Touhy Ave Unit 420
- 7231 N Keeler Ave
- 7245 N Keeler Ave
- 7245 N Keeler Ave
- 7234 N Kedvale Ave
- 7234 N Kedvale Ave
- 7242 N Kedvale Ave
- 7249 N Keeler Ave
- 7249 N Keeler Ave
- 7227 N Keeler Ave
- 7227 N Keeler Ave
- 7244 N Kedvale Ave
- 7224 N Kedvale Ave
- 4175 W Chase Ave
- 7254 N Kedvale Ave
- 7242 N Keeler Ave
- 7242 N Keeler Ave
- 7234 N Keeler Ave
- 7218 N Kedvale Ave
- 7218 N Kedvale Ave
- 7244 N Keeler Ave