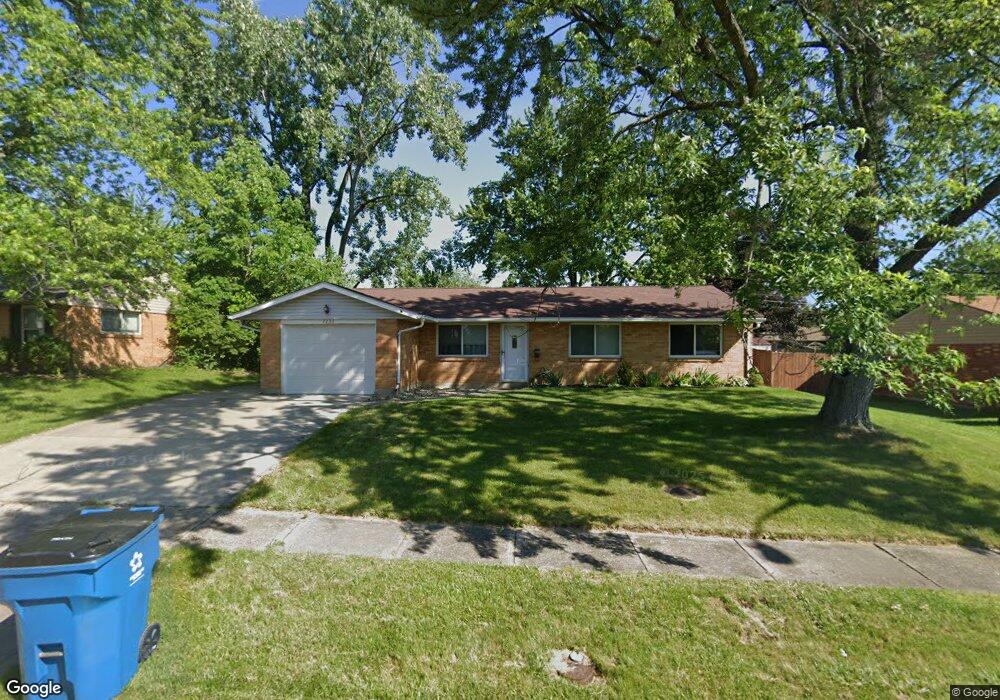
7239 Sancroft Dr Dayton, OH 45424
Estimated Value: $181,000 - $193,000
3
Beds
2
Baths
1,170
Sq Ft
$159/Sq Ft
Est. Value
About This Home
This home is located at 7239 Sancroft Dr, Dayton, OH 45424 and is currently estimated at $186,051, approximately $159 per square foot. 7239 Sancroft Dr is a home located in Montgomery County with nearby schools including Wayne High School and Huber Heights Christian Academy.
Ownership History
Date
Name
Owned For
Owner Type
Purchase Details
Closed on
Jul 6, 2005
Sold by
Hud
Bought by
Bilby Richard A
Current Estimated Value
Home Financials for this Owner
Home Financials are based on the most recent Mortgage that was taken out on this home.
Original Mortgage
$72,500
Interest Rate
5.37%
Mortgage Type
Fannie Mae Freddie Mac
Purchase Details
Closed on
Jun 18, 2003
Sold by
Garner Theresa M and Garner Bryan L
Bought by
Hud
Purchase Details
Closed on
May 24, 2000
Sold by
Granata Stephen A and Granata Tamara E
Bought by
Garner Bryan L and Garner Theresa M
Home Financials for this Owner
Home Financials are based on the most recent Mortgage that was taken out on this home.
Original Mortgage
$88,419
Interest Rate
8.13%
Mortgage Type
FHA
Purchase Details
Closed on
Jun 20, 1996
Sold by
Bakri Samir Z and Bakri Millie E
Bought by
Granata Stephen A and Granata Tamara E
Create a Home Valuation Report for This Property
The Home Valuation Report is an in-depth analysis detailing your home's value as well as a comparison with similar homes in the area
Home Values in the Area
Average Home Value in this Area
Purchase History
| Date | Buyer | Sale Price | Title Company |
|---|---|---|---|
| Bilby Richard A | $72,500 | Lakeside Title & Escrow Agen | |
| Hud | $75,000 | None Available | |
| Garner Bryan L | $88,900 | -- | |
| Granata Stephen A | $74,500 | Midland Title Security Inc |
Source: Public Records
Mortgage History
| Date | Status | Borrower | Loan Amount |
|---|---|---|---|
| Previous Owner | Bilby Richard A | $72,500 | |
| Previous Owner | Garner Bryan L | $88,419 |
Source: Public Records
Tax History
| Year | Tax Paid | Tax Assessment Tax Assessment Total Assessment is a certain percentage of the fair market value that is determined by local assessors to be the total taxable value of land and additions on the property. | Land | Improvement |
|---|---|---|---|---|
| 2025 | $2,647 | $48,180 | $10,150 | $38,030 |
| 2024 | $2,559 | $48,180 | $10,150 | $38,030 |
| 2023 | $2,559 | $48,180 | $10,150 | $38,030 |
| 2022 | $2,230 | $33,190 | $7,000 | $26,190 |
| 2021 | $2,271 | $33,190 | $7,000 | $26,190 |
| 2020 | $2,273 | $33,190 | $7,000 | $26,190 |
| 2019 | $2,145 | $27,670 | $7,000 | $20,670 |
| 2018 | $2,152 | $27,670 | $7,000 | $20,670 |
| 2017 | $2,139 | $27,670 | $7,000 | $20,670 |
| 2016 | $2,035 | $25,620 | $7,000 | $18,620 |
| 2015 | $2,010 | $25,620 | $7,000 | $18,620 |
| 2014 | $2,010 | $25,620 | $7,000 | $18,620 |
| 2012 | -- | $27,200 | $8,750 | $18,450 |
Source: Public Records
Map
Nearby Homes
- 7621 Shalamar Dr
- 7000 Taylorsville Rd
- 6857 Pablo Dr
- 7368 San Fernando Rd
- 7201 Belle Plain Dr
- 2020 Cedar Lake Dr
- 7302 Belle Plain Dr
- 7237 Carmelita Dr
- 8349 Chinaberry Place
- 7515 Beldale Ave
- 7214 Citadel Dr
- 7317 Cosner Dr
- 7657 Belle Plain Dr
- 6529 Larcomb Dr
- 6570 Highbury Rd
- 7250 Robindale St
- 7100 Chatlake Dr
- 8286 Briar Ridge Ct
- 6601 Grovehill Dr
- 6730 Alter Rd
- 7235 Sancroft Dr
- 7243 Sancroft Dr
- 7164 Saffron Dr
- 7156 Saffron Dr
- 7172 Saffron Dr
- 7231 Sancroft Dr
- 7247 Sancroft Dr
- 7240 Sancroft Dr
- 7236 Sancroft Dr
- 7244 Sancroft Dr
- 7148 Saffron Dr
- 7180 Saffron Dr
- 7232 Sancroft Dr
- 7227 Sancroft Dr
- 7251 Sancroft Dr
- 7248 Sancroft Dr
- 7140 Saffron Dr
- 7228 Sancroft Dr
- 7237 Summerdale Dr
- 7241 Summerdale Dr
Your Personal Tour Guide
Ask me questions while you tour the home.