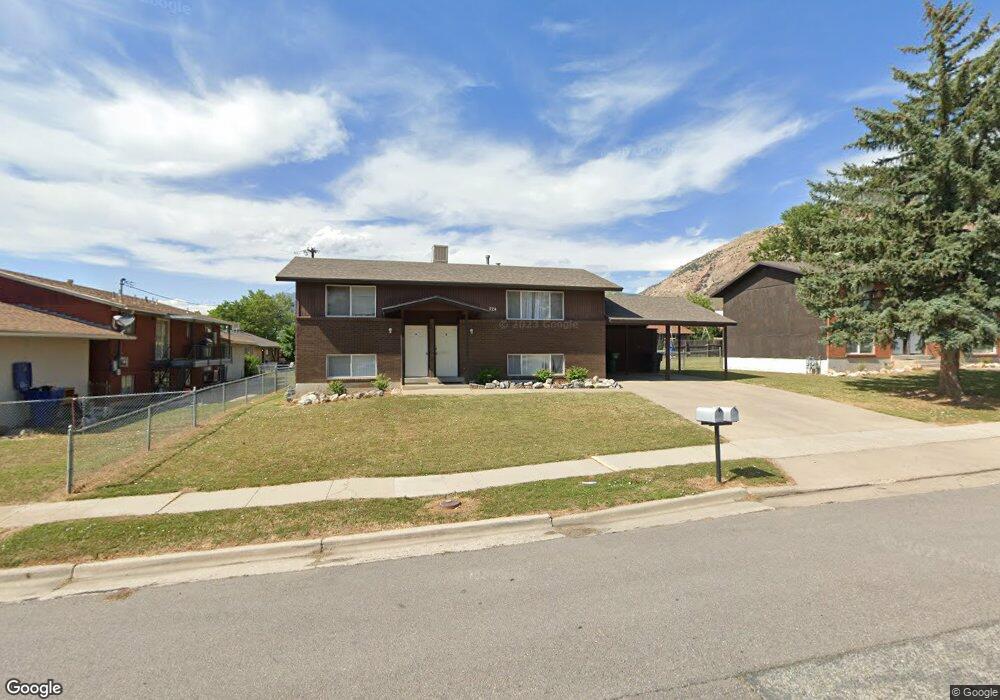
724 Cook St Ogden, UT 84404
Hillcrest-Bonneville NeighborhoodEstimated Value: $355,000 - $445,000
4
Beds
2
Baths
1,960
Sq Ft
$205/Sq Ft
Est. Value
About This Home
This home is located at 724 Cook St, Ogden, UT 84404 and is currently estimated at $402,726, approximately $205 per square foot. 724 Cook St is a home located in Weber County with nearby schools including Bonneville School, Highland Junior High School, and Ben Lomond High School.
Ownership History
Date
Name
Owned For
Owner Type
Purchase Details
Closed on
Jan 7, 2005
Sold by
Whipple Walter L
Bought by
Kunzler Tyler L
Current Estimated Value
Home Financials for this Owner
Home Financials are based on the most recent Mortgage that was taken out on this home.
Original Mortgage
$103,050
Outstanding Balance
$49,429
Interest Rate
5%
Mortgage Type
Adjustable Rate Mortgage/ARM
Estimated Equity
$353,297
Purchase Details
Closed on
Dec 29, 2004
Sold by
The Whipple Family Trust and Whipple Walter L
Bought by
Whipple Walter L
Home Financials for this Owner
Home Financials are based on the most recent Mortgage that was taken out on this home.
Original Mortgage
$103,050
Outstanding Balance
$49,429
Interest Rate
5%
Mortgage Type
Adjustable Rate Mortgage/ARM
Estimated Equity
$353,297
Purchase Details
Closed on
Aug 11, 2003
Sold by
Whipple Walter L
Bought by
Whipple Walter L and Whipple Julie F
Purchase Details
Closed on
Mar 25, 2003
Sold by
Mueller David R and Mueller Mary
Bought by
Whipple Walter L
Purchase Details
Closed on
Aug 22, 2001
Sold by
Blankenship David
Bought by
Whipple Walter L
Create a Home Valuation Report for This Property
The Home Valuation Report is an in-depth analysis detailing your home's value as well as a comparison with similar homes in the area
Home Values in the Area
Average Home Value in this Area
Purchase History
We collect this data history from publicly available records. To have your information removed, we recommend requesting removal directly through your county’s website.
| Date | Buyer | Sale Price | Title Company |
|---|---|---|---|
| Kunzler Tyler L | -- | Mountain View Title Ogden | |
| Whipple Walter L | -- | Mountain View Title Ogden | |
| Whipple Walter L | -- | -- | |
| Whipple Walter L | -- | -- | |
| Whipple Walter L | -- | Associated Title |
Source: Public Records
Mortgage History
We collect this data history from publicly available records. To have your information removed, we recommend requesting removal directly through your county’s website.
| Date | Status | Borrower | Loan Amount |
|---|---|---|---|
| Open | Kunzler Tyler L | $103,050 | |
| Closed | Whipple Walter L | $106,476 |
Source: Public Records
Tax History
| Year | Tax Paid | Tax Assessment Tax Assessment Total Assessment is a certain percentage of the fair market value that is determined by local assessors to be the total taxable value of land and additions on the property. | Land | Improvement |
|---|---|---|---|---|
| 2025 | $2,617 | $383,590 | $100,000 | $283,590 |
| 2024 | $2,598 | $374,000 | $100,000 | $274,000 |
| 2023 | $2,588 | $375,000 | $74,000 | $301,000 |
| 2022 | $2,410 | $350,000 | $50,000 | $300,000 |
| 2021 | $1,916 | $254,000 | $50,000 | $204,000 |
| 2020 | $1,551 | $190,000 | $44,039 | $145,961 |
| 2019 | $1,435 | $165,000 | $34,082 | $130,918 |
| 2018 | $1,323 | $151,195 | $30,232 | $120,963 |
| 2017 | $1,243 | $132,716 | $30,268 | $102,448 |
| 2016 | $1,172 | $67,610 | $16,500 | $51,110 |
| 2015 | $1,129 | $63,559 | $16,500 | $47,059 |
| 2014 | $1,094 | $60,459 | $16,500 | $43,959 |
Source: Public Records
Map
Nearby Homes
- 756 3rd St
- 758 3rd St
- 770 3rd St
- 541 Cook St
- 983 Rancho Blvd Unit 3
- 415 Jackson Ave
- 1029 Douglas St
- 1042 Douglas St
- 312 Ogden Ave
- 421 N Madison Ave
- 598 Plum Creek Ln
- 316 N Liberty Ave
- 615 S Plum Creek Ln E
- 1636 Washington Blvd
- 439 N 630 E
- 1115 Collins Blvd
- 607 S Plum Creek Ln E Unit 34
- 545 Eccles Ave
- 740 N 175 E
- 545 N Madison Ave
Your Personal Tour Guide
Ask me questions while you tour the home.