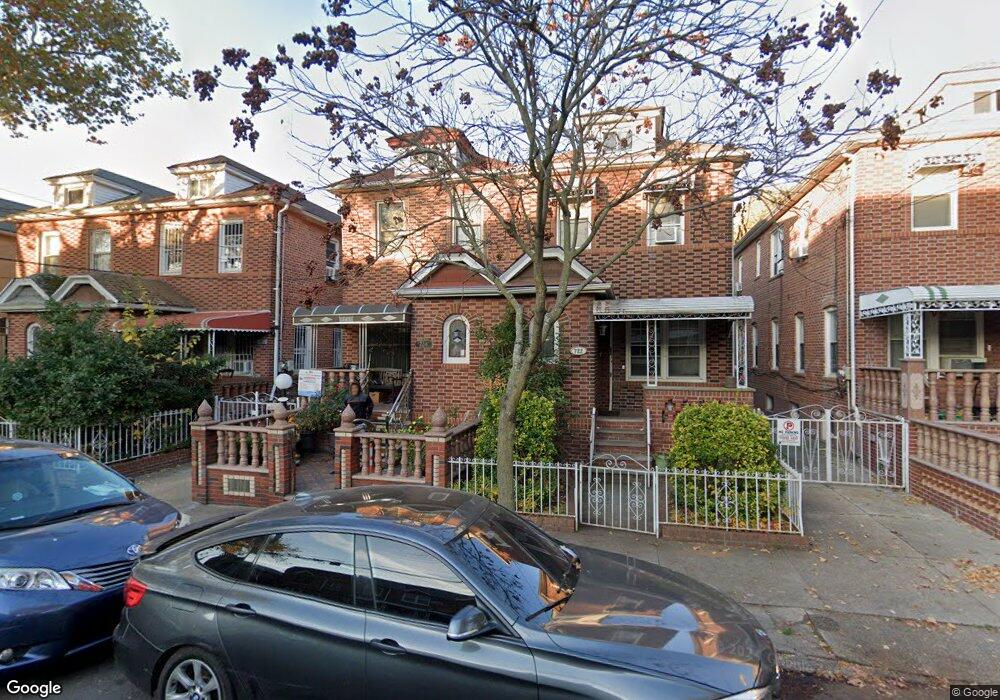
724 E 48th St Unit BASEMENT Brooklyn, NY 11203
East Flatbush NeighborhoodEstimated Value: $693,000 - $821,000
1
Bed
1
Bath
1,702
Sq Ft
$436/Sq Ft
Est. Value
About This Home
This home is located at 724 E 48th St Unit BASEMENT, Brooklyn, NY 11203 and is currently estimated at $741,352, approximately $435 per square foot. 724 E 48th St Unit BASEMENT is a home located in Kings County with nearby schools including P.S. 208 Elsa Ebeling, I.S. 285 Meyer Levin, and Ivy Hill Preparatory Charter School.
Ownership History
Date
Name
Owned For
Owner Type
Purchase Details
Closed on
Jul 14, 2021
Sold by
Strickland Dioni and Torres Dionibeth
Bought by
Begum Nahida and Begum Ullah
Current Estimated Value
Home Financials for this Owner
Home Financials are based on the most recent Mortgage that was taken out on this home.
Original Mortgage
$458,500
Outstanding Balance
$416,018
Interest Rate
2.9%
Mortgage Type
Purchase Money Mortgage
Estimated Equity
$325,334
Purchase Details
Closed on
Jan 26, 2009
Sold by
Isaac Eleanor and Isaac John
Bought by
Torres Dionibeth and Torres Luisa
Home Financials for this Owner
Home Financials are based on the most recent Mortgage that was taken out on this home.
Original Mortgage
$458,943
Interest Rate
5.26%
Mortgage Type
Purchase Money Mortgage
Purchase Details
Closed on
Jan 23, 1997
Sold by
Farragut Realty Associates
Bought by
Aaaa Realty Corp
Create a Home Valuation Report for This Property
The Home Valuation Report is an in-depth analysis detailing your home's value as well as a comparison with similar homes in the area
Home Values in the Area
Average Home Value in this Area
Purchase History
| Date | Buyer | Sale Price | Title Company |
|---|---|---|---|
| Begum Nahida | $655,000 | -- | |
| Torres Dionibeth | $465,000 | -- | |
| Aaaa Realty Corp | -- | -- |
Source: Public Records
Mortgage History
| Date | Status | Borrower | Loan Amount |
|---|---|---|---|
| Open | Begum Nahida | $458,500 | |
| Previous Owner | Torres Dionibeth | $458,943 |
Source: Public Records
Tax History
| Year | Tax Paid | Tax Assessment Tax Assessment Total Assessment is a certain percentage of the fair market value that is determined by local assessors to be the total taxable value of land and additions on the property. | Land | Improvement |
|---|---|---|---|---|
| 2025 | $6,187 | $41,400 | $13,680 | $27,720 |
| 2024 | $6,187 | $42,660 | $13,680 | $28,980 |
| 2023 | $5,902 | $43,500 | $13,680 | $29,820 |
| 2022 | $5,603 | $39,300 | $13,680 | $25,620 |
| 2021 | $5,907 | $40,680 | $13,680 | $27,000 |
| 2020 | $2,846 | $34,020 | $13,680 | $20,340 |
| 2019 | $5,370 | $30,540 | $13,680 | $16,860 |
| 2018 | $4,937 | $24,218 | $10,598 | $13,620 |
| 2017 | $4,768 | $23,389 | $10,255 | $13,134 |
| 2016 | $4,676 | $23,389 | $11,493 | $11,896 |
| 2015 | $2,661 | $22,674 | $11,877 | $10,797 |
| 2014 | $2,661 | $21,392 | $9,528 | $11,864 |
Source: Public Records
Map
Nearby Homes
- 758 E 48th St
- 701 E 48th St
- 1214 Schenectady Ave
- 4617 Clarendon Rd
- 4623 Avenue D
- 702 E 51st St
- 1278 Schenectady Ave
- 4824 Beverley Rd
- 820 E 49th St
- 4404 Clarendon Rd
- 1245 Troy Ave
- 5022 Avenue D
- 843 E 49th St
- 1246 Troy Ave
- 853 E 49th St
- 814 E 51st St
- 711 E 52nd St
- 863 E 49th St
- 872 E 48th St
- 442 E 43rd St
- 724 E 48th St
- 722 E 48th St
- 726 E 48th St
- 720 E 48th St
- 728 E 48th St
- 732 E 48th St
- 716 E 48th St
- 734 E 48th St
- 734 E 48th St Unit BASEMENT
- 714 E 48th St
- 734 E 48 St
- 1191 Schenectady Ave
- 1193 Schenectady Ave
- 736 E 48th St
- 1189 Schenectady Ave
- 710 E 48th St
- 1187 Schenectady Ave
- 1197 Schenectady Ave
- 1183-1185 Schenectady Ave
- 1183 Schenectady Ave Unit 1185
Your Personal Tour Guide
Ask me questions while you tour the home.