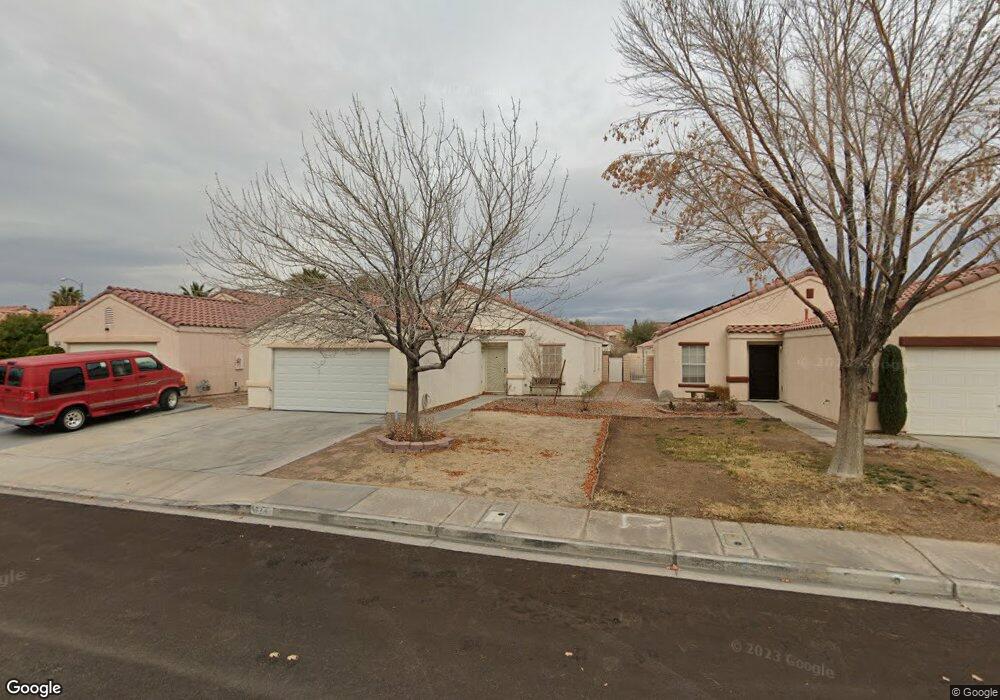
724 Forest Haven Way Henderson, NV 89011
South Valley Ranch NeighborhoodEstimated Value: $364,000 - $400,000
4
Beds
2
Baths
1,382
Sq Ft
$275/Sq Ft
Est. Value
About This Home
This home is located at 724 Forest Haven Way, Henderson, NV 89011 and is currently estimated at $379,889, approximately $274 per square foot. 724 Forest Haven Way is a home located in Clark County with nearby schools including Josh Stevens Elementary School, Francis H Cortney Junior High School, and Basic Academy of International Studies.
Ownership History
Date
Name
Owned For
Owner Type
Purchase Details
Closed on
Jul 26, 2006
Sold by
Lacivita Mark
Bought by
Lacivita Mark
Current Estimated Value
Home Financials for this Owner
Home Financials are based on the most recent Mortgage that was taken out on this home.
Original Mortgage
$38,000
Interest Rate
6.57%
Mortgage Type
New Conventional
Purchase Details
Closed on
Apr 25, 2003
Sold by
Chattin Pamela J
Bought by
Lacivita Mark
Home Financials for this Owner
Home Financials are based on the most recent Mortgage that was taken out on this home.
Original Mortgage
$153,589
Outstanding Balance
$66,417
Interest Rate
5.84%
Mortgage Type
FHA
Estimated Equity
$313,472
Purchase Details
Closed on
Apr 6, 2000
Sold by
Kaufman & Broad Of Nevada Inc
Bought by
Chattin Pamela J
Home Financials for this Owner
Home Financials are based on the most recent Mortgage that was taken out on this home.
Original Mortgage
$95,045
Interest Rate
8.99%
Create a Home Valuation Report for This Property
The Home Valuation Report is an in-depth analysis detailing your home's value as well as a comparison with similar homes in the area
Home Values in the Area
Average Home Value in this Area
Purchase History
| Date | Buyer | Sale Price | Title Company |
|---|---|---|---|
| Lacivita Mark | -- | Commonwealth Title | |
| Lacivita Mark | $156,000 | Equity Title Of Nevada | |
| Chattin Pamela J | $118,807 | First American Title Ins Co |
Source: Public Records
Mortgage History
| Date | Status | Borrower | Loan Amount |
|---|---|---|---|
| Closed | Lacivita Mark | $38,000 | |
| Open | Lacivita Mark | $153,589 | |
| Previous Owner | Chattin Pamela J | $95,045 | |
| Closed | Chattin Pamela J | $23,761 |
Source: Public Records
Tax History Compared to Growth
Tax History
| Year | Tax Paid | Tax Assessment Tax Assessment Total Assessment is a certain percentage of the fair market value that is determined by local assessors to be the total taxable value of land and additions on the property. | Land | Improvement |
|---|---|---|---|---|
| 2025 | $1,587 | $86,156 | $31,150 | $55,006 |
| 2024 | $1,740 | $86,156 | $31,150 | $55,006 |
| 2023 | $1,740 | $81,496 | $29,400 | $52,096 |
| 2022 | $1,361 | $72,380 | $24,850 | $47,530 |
| 2021 | $1,261 | $66,933 | $21,700 | $45,233 |
| 2020 | $1,168 | $66,613 | $21,700 | $44,913 |
| 2019 | $1,094 | $63,278 | $18,900 | $44,378 |
| 2018 | $1,044 | $57,989 | $15,400 | $42,589 |
| 2017 | $1,614 | $55,671 | $12,600 | $43,071 |
| 2016 | $979 | $51,339 | $9,800 | $41,539 |
| 2015 | $976 | $40,124 | $8,050 | $32,074 |
| 2014 | $947 | $31,721 | $6,125 | $25,596 |
Source: Public Records
Map
Nearby Homes
- 740 Moonlight Mesa Dr
- 1013 Adobe Flat Dr
- 949 Adobe Flat Dr
- 733 Hitchen Post Dr
- 624 Black Sand Ct
- 672 Hitchen Post Dr
- 648 Hitchen Post Dr Unit DII
- 1065 Blue Sands Ct
- 632 Hitchen Post Dr
- 608 Black Sand Ct
- 833 Aspen Peak Loop Unit 1026
- 833 Aspen Peak Loop Unit 121
- 833 Aspen Peak Loop Unit 712
- 833 Aspen Peak Loop Unit 1524
- 833 Aspen Peak Loop Unit 814
- 833 Aspen Peak Loop Unit 613
- 833 Aspen Peak Loop Unit 2613
- 564 Ruby Robin Ave
- 564 Ruby Robin Ave Unit Lot 710
- 7102 Shimmering Ave
- 720 Forest Haven Way
- 728 Forest Haven Way
- 732 Forest Haven Way Unit CIV
- 732 Forest Haven Way
- 716 Forest Haven Way
- 721 Rising Brook Dr
- 725 Rising Brook Dr
- 717 Rising Brook Dr
- 717 Rising Brook Dr Unit na
- 712 Forest Haven Way Unit CIV
- 712 Forest Haven Way
- 712 Forest Haven Way
- 712 Forest Haven Way
- 736 Forest Haven Way
- 729 Rising Brook Dr
- 713 Rising Brook Dr
- 725 Forest Haven Way
- 721 Forest Haven Way
- 729 Forest Haven Way Unit CII
- 733 Rising Brook Dr