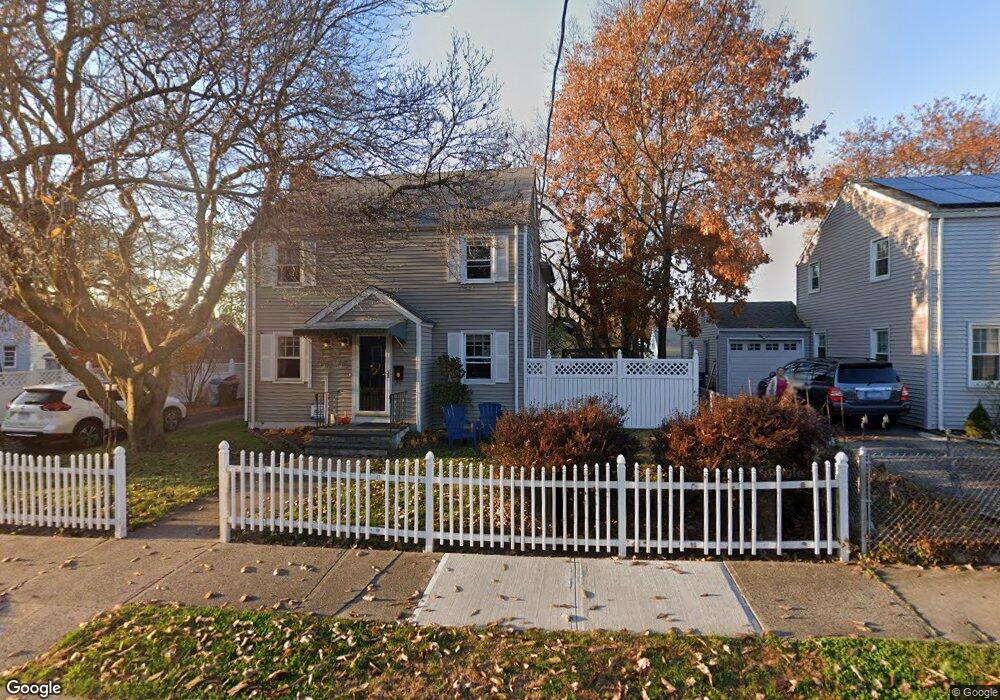
724 Goldenrod Ave Bridgeport, CT 06606
North End NeighborhoodEstimated Value: $415,000 - $462,274
3
Beds
2
Baths
1,580
Sq Ft
$281/Sq Ft
Est. Value
About This Home
This home is located at 724 Goldenrod Ave, Bridgeport, CT 06606 and is currently estimated at $443,319, approximately $280 per square foot. 724 Goldenrod Ave is a home located in Fairfield County with nearby schools including Blackham School, Central High School, and St Andrew School.
Ownership History
Date
Name
Owned For
Owner Type
Purchase Details
Closed on
May 31, 2005
Sold by
Thomas Kurt and Thomas Katia
Bought by
Satterfield Samuel and Satterfield Kathryn
Current Estimated Value
Home Financials for this Owner
Home Financials are based on the most recent Mortgage that was taken out on this home.
Original Mortgage
$239,750
Outstanding Balance
$118,989
Interest Rate
5%
Estimated Equity
$324,330
Purchase Details
Closed on
Oct 25, 2002
Sold by
Parrella Adrianna and Franchi Antonio B
Bought by
Thomas Kurt E and Thomas Katia Almeida
Purchase Details
Closed on
Oct 2, 2000
Sold by
Sogliuzzi Salvatore
Bought by
Parrella Adriana
Purchase Details
Closed on
Dec 2, 1999
Sold by
Department Of Housing & Urban Dev
Bought by
Tamburo Mark
Purchase Details
Closed on
Apr 19, 1999
Sold by
Rudd Beth A
Bought by
Department Of Housing & Urban Dev
Create a Home Valuation Report for This Property
The Home Valuation Report is an in-depth analysis detailing your home's value as well as a comparison with similar homes in the area
Home Values in the Area
Average Home Value in this Area
Purchase History
| Date | Buyer | Sale Price | Title Company |
|---|---|---|---|
| Satterfield Samuel | $305,000 | -- | |
| Satterfield Samuel | $305,000 | -- | |
| Thomas Kurt E | $216,500 | -- | |
| Parrella Adriana | $135,000 | -- | |
| Parrella Adriana | $135,000 | -- | |
| Tamburo Mark | $70,000 | -- | |
| Tamburo Mark | $70,000 | -- | |
| Department Of Housing & Urban Dev | $129,037 | -- | |
| Department Of Housing & Urban Dev | $129,037 | -- |
Source: Public Records
Mortgage History
| Date | Status | Borrower | Loan Amount |
|---|---|---|---|
| Open | Department Of Housing & Urban Dev | $239,750 | |
| Closed | Department Of Housing & Urban Dev | $239,750 |
Source: Public Records
Tax History Compared to Growth
Tax History
| Year | Tax Paid | Tax Assessment Tax Assessment Total Assessment is a certain percentage of the fair market value that is determined by local assessors to be the total taxable value of land and additions on the property. | Land | Improvement |
|---|---|---|---|---|
| 2025 | $7,707 | $177,380 | $77,830 | $99,550 |
| 2024 | $7,707 | $177,380 | $77,830 | $99,550 |
| 2023 | $7,707 | $177,380 | $77,830 | $99,550 |
| 2022 | $7,707 | $177,380 | $77,830 | $99,550 |
| 2021 | $7,707 | $177,380 | $77,830 | $99,550 |
| 2020 | $7,191 | $133,200 | $44,720 | $88,480 |
| 2019 | $7,191 | $133,200 | $44,720 | $88,480 |
| 2018 | $7,242 | $133,200 | $44,720 | $88,480 |
| 2017 | $7,242 | $133,200 | $44,720 | $88,480 |
| 2016 | $7,242 | $133,200 | $44,720 | $88,480 |
| 2015 | $6,930 | $164,220 | $51,670 | $112,550 |
| 2014 | $6,930 | $164,220 | $51,670 | $112,550 |
Source: Public Records
Map
Nearby Homes
- 2346 Madison Ave
- 69 Plankton St
- 720 Queen St
- 129 Ashton St
- 81 Ameridge Dr
- 605 Merritt St
- 38 Enid St Unit B
- 17 Teresa Place Unit 17
- 495 Peet St
- 375 Ruth St
- 226 Alberta St
- 161 Brion Dr
- 3989 Park Ave
- 783 Clark St
- 3450 Park Ave
- 604 Birmingham St
- 932 Thorme St
- 3430 Park Ave
- 90 Lu Manor Dr
- 12 Riverview Dr Unit 12
- 712 Goldenrod Ave
- 727 Jewett Ave
- 726 Goldenrod Ave
- 700 Goldenrod Ave
- 717 Jewett Ave
- 721 Goldenrod Ave
- 2430 Madison Ave
- 735 Goldenrod Ave
- 705 Jewett Ave
- 705 Goldenrod Ave
- 2420 Madison Ave
- 690 Goldenrod Ave
- 2384 Madison Ave
- 695 Jewett Ave
- 2372 Madison Ave
- 691 Goldenrod Ave
- 693 Jewett Ave
- 2444 Madison Ave
- 2405 Madison Ave
- 676 Goldenrod Ave