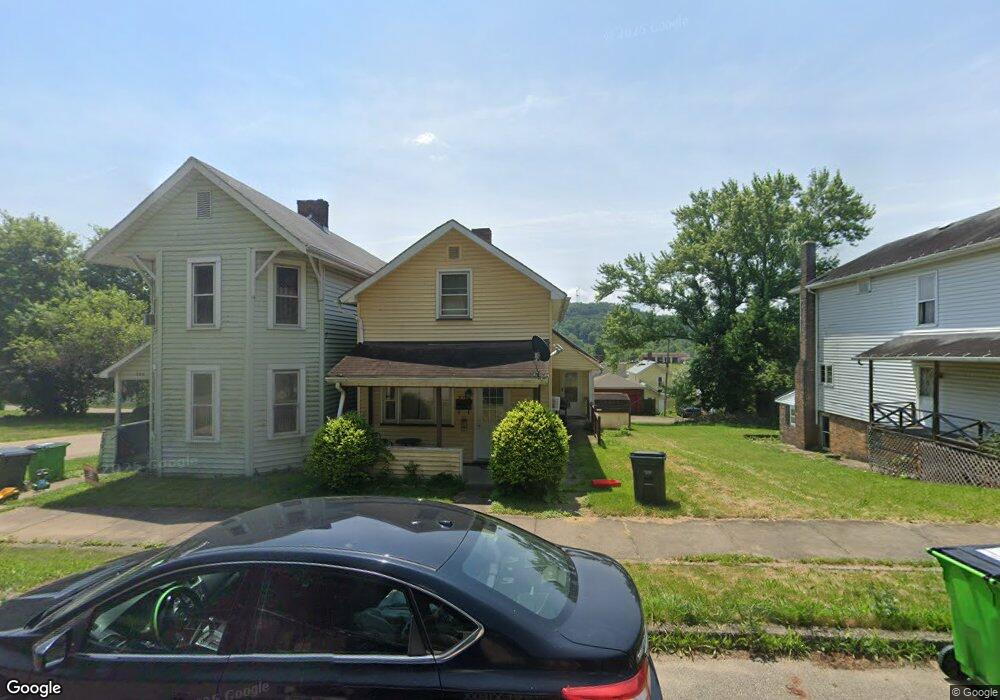
724 Grant St Dennison, OH 44621
Estimated Value: $64,097 - $101,000
2
Beds
1
Bath
720
Sq Ft
$122/Sq Ft
Est. Value
About This Home
This home is located at 724 Grant St, Dennison, OH 44621 and is currently estimated at $87,524, approximately $121 per square foot. 724 Grant St is a home located in Tuscarawas County with nearby schools including Claymont High School and Immaculate Conception School.
Ownership History
Date
Name
Owned For
Owner Type
Purchase Details
Closed on
Aug 30, 2019
Sold by
Snyder James M and Snyder Mega A
Bought by
Fishel Ricky D
Current Estimated Value
Home Financials for this Owner
Home Financials are based on the most recent Mortgage that was taken out on this home.
Original Mortgage
$24,800
Outstanding Balance
$16,531
Interest Rate
3.8%
Mortgage Type
Future Advance Clause Open End Mortgage
Estimated Equity
$70,993
Purchase Details
Closed on
Feb 14, 2011
Sold by
Tedrick Robert A and Tedrick Sandra K
Bought by
Snyder James M and Snyder Mega A
Create a Home Valuation Report for This Property
The Home Valuation Report is an in-depth analysis detailing your home's value as well as a comparison with similar homes in the area
Home Values in the Area
Average Home Value in this Area
Purchase History
| Date | Buyer | Sale Price | Title Company |
|---|---|---|---|
| Fishel Ricky D | $31,000 | Entrust Title | |
| Snyder James M | $14,000 | Alban Title |
Source: Public Records
Mortgage History
| Date | Status | Borrower | Loan Amount |
|---|---|---|---|
| Open | Fishel Ricky D | $24,800 |
Source: Public Records
Tax History
| Year | Tax Paid | Tax Assessment Tax Assessment Total Assessment is a certain percentage of the fair market value that is determined by local assessors to be the total taxable value of land and additions on the property. | Land | Improvement |
|---|---|---|---|---|
| 2024 | $495 | $13,270 | $2,010 | $11,260 |
| 2023 | $495 | $37,910 | $5,750 | $32,160 |
| 2022 | $500 | $13,269 | $2,013 | $11,256 |
| 2021 | $462 | $11,428 | $1,526 | $9,902 |
| 2020 | $472 | $11,428 | $1,526 | $9,902 |
| 2019 | $452 | $11,428 | $1,526 | $9,902 |
| 2018 | $412 | $9,640 | $1,290 | $8,350 |
| 2017 | $423 | $9,640 | $1,290 | $8,350 |
| 2016 | $415 | $9,640 | $1,290 | $8,350 |
| 2014 | $471 | $10,710 | $1,230 | $9,480 |
| 2013 | $477 | $10,710 | $1,230 | $9,480 |
Source: Public Records
Map
Nearby Homes
- 118 Woodland Ave
- 318 Bank St
- 11 Sherman St
- 222 Mccarty Ave
- 228 Gardner Ave
- 426 Mccrea Ave
- 530 E High St
- 213 Fuhr St
- 214 N Dawson St
- 4848 Fette Rd SE
- 129 S Main St
- 911 N Water St
- 618 Parrish St
- 507 W 3rd St
- 315 Orchard St
- 527 W 3rd St
- 621 Newport Ave
- 119 S Wallace St
- 7261 Waterworks Hill Rd SE
- 335 Packer St
Your Personal Tour Guide
Ask me questions while you tour the home.