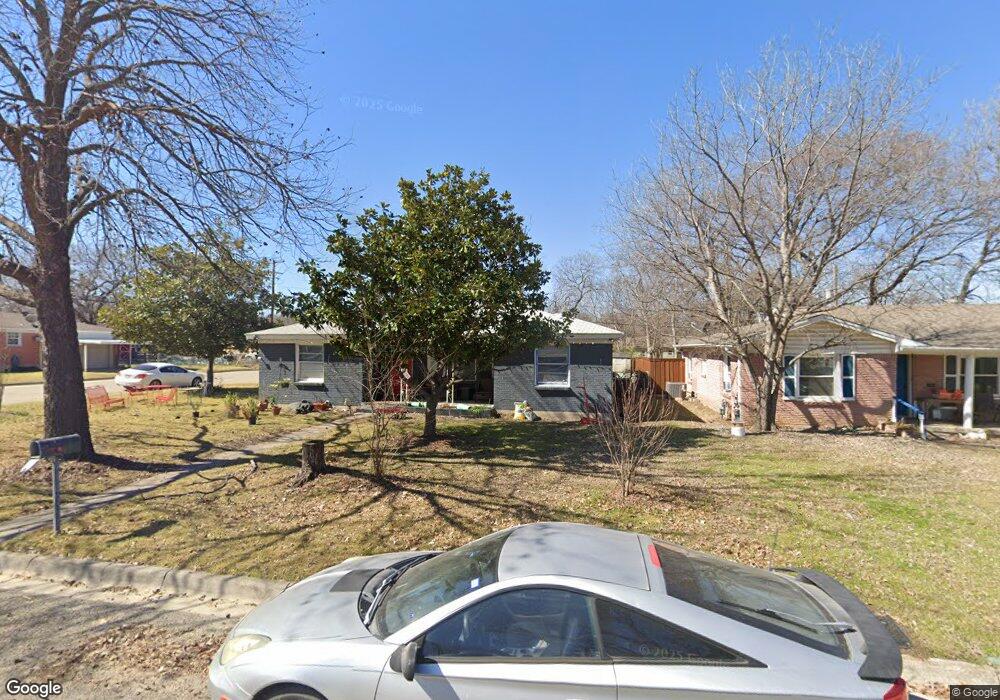
724 June Dr Fort Worth, TX 76108
Estimated Value: $217,070 - $236,000
3
Beds
2
Baths
1,302
Sq Ft
$173/Sq Ft
Est. Value
About This Home
This home is located at 724 June Dr, Fort Worth, TX 76108 and is currently estimated at $225,018, approximately $172 per square foot. 724 June Dr is a home located in Tarrant County with nearby schools including Liberty Elementary School, Brewer Middle School, and Tannahill Intermediate School.
Ownership History
Date
Name
Owned For
Owner Type
Purchase Details
Closed on
Aug 9, 2019
Sold by
Carnley Nancy Sue
Bought by
Maas Group Llc
Current Estimated Value
Home Financials for this Owner
Home Financials are based on the most recent Mortgage that was taken out on this home.
Original Mortgage
$92,250
Interest Rate
3.73%
Mortgage Type
Commercial
Purchase Details
Closed on
Mar 13, 2015
Sold by
Blassingame Sandra Kay
Bought by
Carnley Nancy Sue and Blassingame Sandra Kay
Purchase Details
Closed on
Mar 11, 2015
Sold by
Blassingame Wiley Franklin and Blassingame Gale Leon
Bought by
Blassingame Sandra Kay
Create a Home Valuation Report for This Property
The Home Valuation Report is an in-depth analysis detailing your home's value as well as a comparison with similar homes in the area
Home Values in the Area
Average Home Value in this Area
Purchase History
| Date | Buyer | Sale Price | Title Company |
|---|---|---|---|
| Maas Group Llc | -- | Itc | |
| Carnley Nancy Sue | -- | None Available | |
| Blassingame Sandra Kay | -- | None Available |
Source: Public Records
Mortgage History
| Date | Status | Borrower | Loan Amount |
|---|---|---|---|
| Closed | Maas Group Llc | $92,250 |
Source: Public Records
Tax History Compared to Growth
Tax History
| Year | Tax Paid | Tax Assessment Tax Assessment Total Assessment is a certain percentage of the fair market value that is determined by local assessors to be the total taxable value of land and additions on the property. | Land | Improvement |
|---|---|---|---|---|
| 2025 | $4,888 | $206,338 | $45,190 | $161,148 |
| 2024 | $4,888 | $206,338 | $45,190 | $161,148 |
| 2023 | $5,168 | $217,359 | $45,190 | $172,169 |
| 2022 | $4,439 | $163,932 | $25,000 | $138,932 |
| 2021 | $3,310 | $120,325 | $25,000 | $95,325 |
| 2020 | $3,334 | $120,325 | $25,000 | $95,325 |
| 2019 | $3,382 | $117,572 | $25,000 | $92,572 |
| 2018 | $2,757 | $95,847 | $12,000 | $83,847 |
| 2017 | $2,470 | $84,505 | $12,000 | $72,505 |
| 2016 | $2,411 | $82,495 | $12,000 | $70,495 |
| 2015 | -- | $65,900 | $10,000 | $55,900 |
| 2014 | -- | $65,900 | $10,000 | $55,900 |
Source: Public Records
Map
Nearby Homes