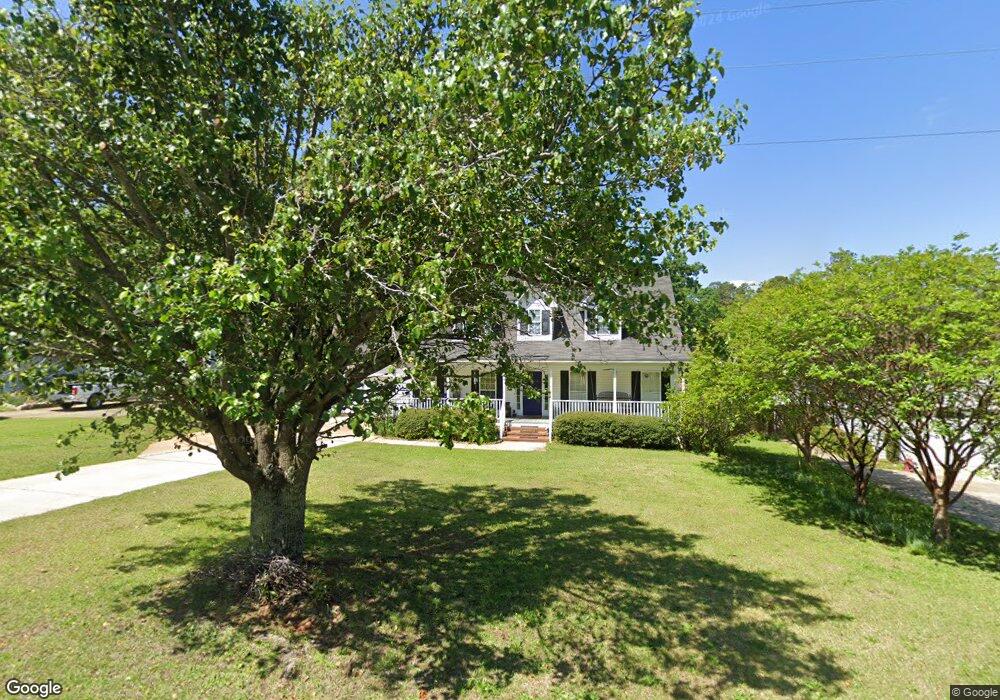
724 Murray Lindler Rd Chapin, SC 29036
Estimated Value: $263,459 - $305,000
3
Beds
3
Baths
1,755
Sq Ft
$163/Sq Ft
Est. Value
About This Home
This home is located at 724 Murray Lindler Rd, Chapin, SC 29036 and is currently estimated at $285,615, approximately $162 per square foot. 724 Murray Lindler Rd is a home located in Lexington County with nearby schools including Chapin Elementary School, Chapin Intermediate, and Chapin High School.
Ownership History
Date
Name
Owned For
Owner Type
Purchase Details
Closed on
Oct 16, 2015
Sold by
Angel Gary
Bought by
Rawleigh Alissa
Current Estimated Value
Home Financials for this Owner
Home Financials are based on the most recent Mortgage that was taken out on this home.
Original Mortgage
$115,000
Outstanding Balance
$90,634
Interest Rate
3.93%
Mortgage Type
New Conventional
Estimated Equity
$194,981
Purchase Details
Closed on
Jun 25, 2015
Sold by
Hopkins Donald J and Hopkins Amy
Bought by
Angel Gary
Purchase Details
Closed on
Nov 5, 2010
Sold by
Griffin Jamie K
Bought by
Hopkins Donald J and Hopkins Amy
Home Financials for this Owner
Home Financials are based on the most recent Mortgage that was taken out on this home.
Original Mortgage
$149,100
Interest Rate
4.38%
Mortgage Type
Future Advance Clause Open End Mortgage
Purchase Details
Closed on
Mar 28, 2006
Sold by
Holmes Kelly S
Bought by
Griffin Jamie K
Home Financials for this Owner
Home Financials are based on the most recent Mortgage that was taken out on this home.
Original Mortgage
$150,537
Interest Rate
6.25%
Mortgage Type
FHA
Create a Home Valuation Report for This Property
The Home Valuation Report is an in-depth analysis detailing your home's value as well as a comparison with similar homes in the area
Home Values in the Area
Average Home Value in this Area
Purchase History
| Date | Buyer | Sale Price | Title Company |
|---|---|---|---|
| Rawleigh Alissa | $65,576 | -- | |
| Angel Gary | $125,100 | -- | |
| Hopkins Donald J | $157,000 | -- | |
| Griffin Jamie K | $152,900 | None Available |
Source: Public Records
Mortgage History
| Date | Status | Borrower | Loan Amount |
|---|---|---|---|
| Open | Rawleigh Alissa | $115,000 | |
| Previous Owner | Hopkins Donald J | $149,100 | |
| Previous Owner | Griffin Jamie K | $150,537 |
Source: Public Records
Tax History Compared to Growth
Tax History
| Year | Tax Paid | Tax Assessment Tax Assessment Total Assessment is a certain percentage of the fair market value that is determined by local assessors to be the total taxable value of land and additions on the property. | Land | Improvement |
|---|---|---|---|---|
| 2024 | $1,050 | $6,377 | $1,040 | $5,337 |
| 2023 | $976 | $6,377 | $1,040 | $5,337 |
| 2022 | $985 | $6,377 | $1,040 | $5,337 |
| 2020 | $1,032 | $6,377 | $1,040 | $5,337 |
| 2019 | $987 | $6,000 | $1,040 | $4,960 |
| 2018 | $869 | $6,000 | $1,040 | $4,960 |
| 2017 | $846 | $6,000 | $1,040 | $4,960 |
| 2016 | $867 | $6,000 | $1,040 | $4,960 |
| 2014 | $3,674 | $9,419 | $1,560 | $7,859 |
| 2013 | -- | $9,420 | $1,560 | $7,860 |
Source: Public Records
Map
Nearby Homes
- 3006 Chilmark Rd
- 161 Dutchman Shores Cir
- 147 Ventnor Ave
- 0 Lakeshore Dr
- 540 Lakeshore Dr
- 409 Dutchman Shores Cir
- 108 Pennsylvania Ct
- 100 Palm St
- 100 Baltic Ct
- 0 Dreher Island Rd Unit 21647709
- 0 Dreher Island Rd Unit 587193
- 117 Bay Front Dr
- 510 Lilypad Ct
- 535 Sandbar Rd
- 908 Old Lexington Hwy
- 125 Northshore Dr
- 457 Amicks Ferry Rd
- 417 Northshore Ct
- 412 Northshore Ct
- 520 Walt Rauch Rd
- 720 Murray Lindler Rd
- 728 Murray Lindler Rd
- 105 Kerry Gibbons Dr
- 119 Moyer Dr
- 115 Moyer Dr
- 109 Kerry Gibbons Dr
- 716 Murray Lindler Rd
- 100 Kerry Gibbons Dr
- 719 Murray Lindler Rd
- 111 Moyer Dr
- 104 Kerry Gibbons Dr
- 709 Murray Lindler Rd
- 101 Moyer Dr
- 712 Murray Lindler Rd
- 123 Moyer Dr
- 107 Moyer Dr
- 108 Kerry Gibbons Dr
- 737 Murray Lindler Rd
- 708 Murray Lindler Rd
- 743 Murray Lindler Rd