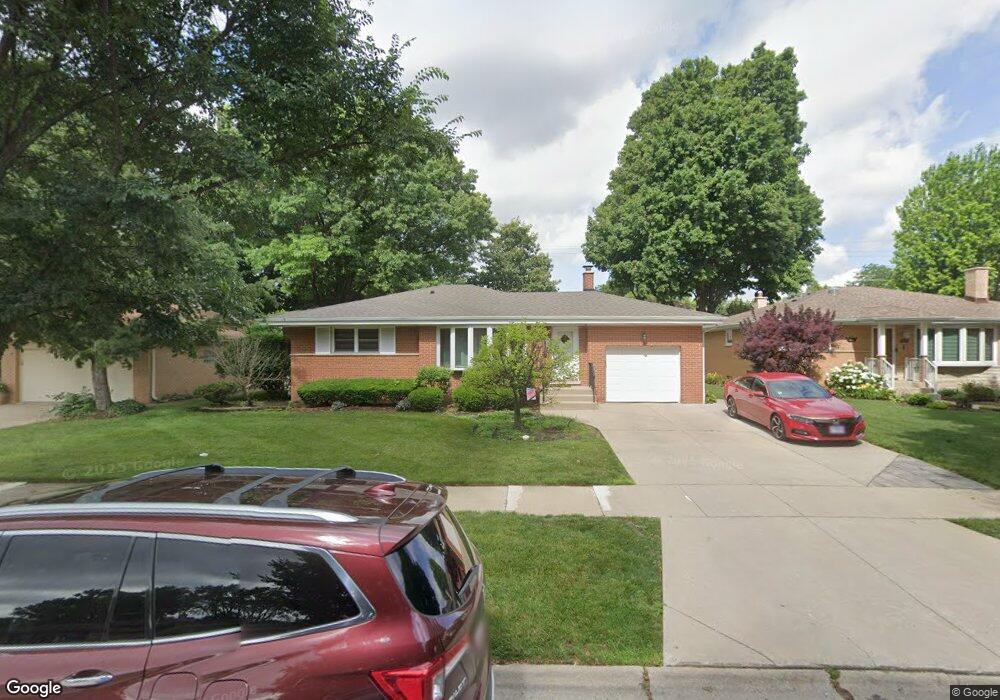
724 N Drury Ln Unit 3 Arlington Heights, IL 60004
Estimated Value: $477,007 - $537,000
4
Beds
2
Baths
1,352
Sq Ft
$365/Sq Ft
Est. Value
About This Home
This home is located at 724 N Drury Ln Unit 3, Arlington Heights, IL 60004 and is currently estimated at $493,752, approximately $365 per square foot. 724 N Drury Ln Unit 3 is a home located in Cook County with nearby schools including Olive-Mary Stitt Elementary School, South Middle School, and Prospect High School.
Ownership History
Date
Name
Owned For
Owner Type
Purchase Details
Closed on
Sep 12, 2017
Sold by
Olson Brian J and Olson Catherine V
Bought by
Mehta Sonali and Veeramachaneni Harish
Current Estimated Value
Home Financials for this Owner
Home Financials are based on the most recent Mortgage that was taken out on this home.
Original Mortgage
$284,665
Outstanding Balance
$238,288
Interest Rate
3.99%
Mortgage Type
New Conventional
Estimated Equity
$255,464
Purchase Details
Closed on
May 26, 2011
Sold by
Dec Hoppe Kathleen
Bought by
Olson Brian J and Olson Catherine V
Home Financials for this Owner
Home Financials are based on the most recent Mortgage that was taken out on this home.
Original Mortgage
$203,250
Interest Rate
4.75%
Mortgage Type
New Conventional
Purchase Details
Closed on
Feb 3, 2001
Sold by
Hoppe Carlyle R
Bought by
Dec Hoppe Carlyle Richard and Carlyle Richard Hoppe Self Declaration O
Create a Home Valuation Report for This Property
The Home Valuation Report is an in-depth analysis detailing your home's value as well as a comparison with similar homes in the area
Home Values in the Area
Average Home Value in this Area
Purchase History
| Date | Buyer | Sale Price | Title Company |
|---|---|---|---|
| Mehta Sonali | $335,000 | Attorneys Title Guaranty Fun | |
| Olson Brian J | $271,000 | Attorneys Title Guaranty Fun | |
| Dec Hoppe Carlyle Richard | -- | -- |
Source: Public Records
Mortgage History
| Date | Status | Borrower | Loan Amount |
|---|---|---|---|
| Open | Mehta Sonali | $284,665 | |
| Previous Owner | Olson Brian J | $203,250 |
Source: Public Records
Tax History Compared to Growth
Tax History
| Year | Tax Paid | Tax Assessment Tax Assessment Total Assessment is a certain percentage of the fair market value that is determined by local assessors to be the total taxable value of land and additions on the property. | Land | Improvement |
|---|---|---|---|---|
| 2024 | $8,558 | $34,576 | $8,712 | $25,864 |
| 2023 | $8,215 | $34,576 | $8,712 | $25,864 |
| 2022 | $8,215 | $34,576 | $8,712 | $25,864 |
| 2021 | $7,943 | $29,717 | $5,009 | $24,708 |
| 2020 | $7,804 | $29,717 | $5,009 | $24,708 |
| 2019 | $7,798 | $33,130 | $5,009 | $28,121 |
| 2018 | $8,070 | $27,655 | $4,356 | $23,299 |
| 2017 | $7,002 | $27,655 | $4,356 | $23,299 |
| 2016 | $6,767 | $27,655 | $4,356 | $23,299 |
| 2015 | $6,761 | $25,520 | $3,702 | $21,818 |
| 2014 | $6,579 | $25,520 | $3,702 | $21,818 |
| 2013 | $6,397 | $25,520 | $3,702 | $21,818 |
Source: Public Records
Map
Nearby Homes
- 1605 E Frederick St
- 1016 N Derbyshire Ave
- 1804 E Euclid Ave
- 315 N Drury Ln
- 1101 N Stratford Rd
- 915 E Saint James St
- 1615 E Miner St
- 1504 E Olive St
- 907 Hamlin Ln
- 415 N Haddow Ave
- 815 E Olive St
- 805 E Hamlin Ln
- 209 N Douglas Ave
- 2403 E Brandenberry Ct Unit 2A
- 25 N Prindle Ave
- 1215 N Waterman Ave Unit 3L
- 2443 E Brandenberry Ct Unit 1B
- 2443 E Brandenberry Ct Unit 2A
- 2431 E Brandenberry Ct Unit 2O
- 300 E Euclid Ave
- 730 N Drury Ln
- 718 N Drury Ln
- 712 N Drury Ln
- 734 N Drury Ln
- 727 N Carlyle Ln
- 803 N Carlyle Ln
- 721 N Carlyle Ln
- 708 N Drury Ln
- 738 N Drury Ln
- 809 N Carlyle Ln
- 719 N Drury Ln
- 725 N Drury Ln
- 715 N Drury Ln
- 717 N Carlyle Ln Unit 11
- 729 N Drury Ln
- 709 N Drury Ln
- 817 N Carlyle Ln
- 706 N Drury Ln
- 802 N Drury Ln
- 735 N Drury Ln