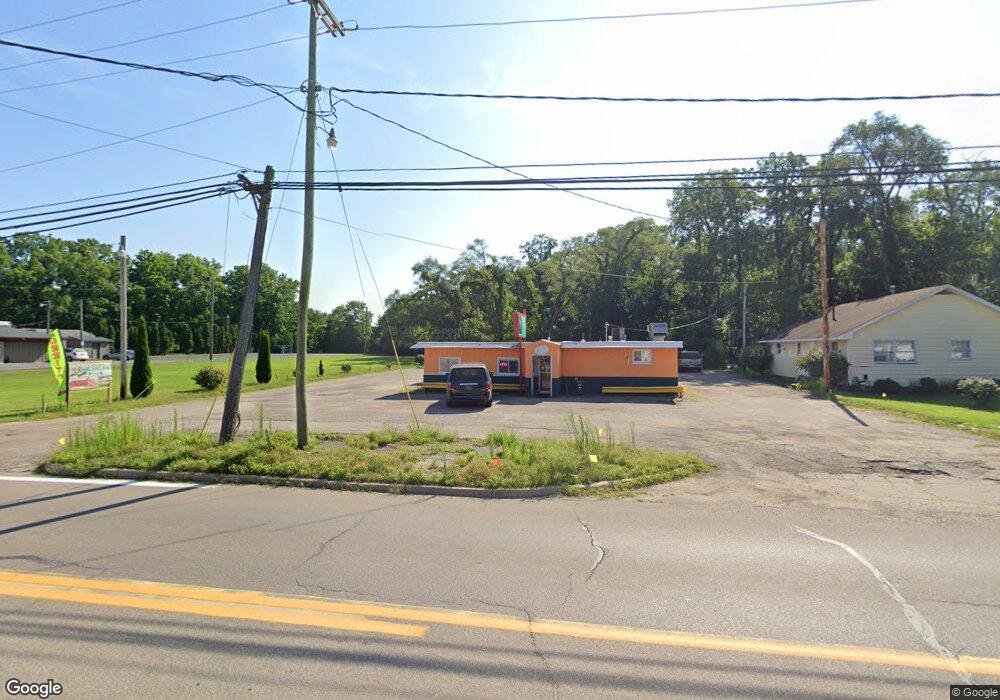
724 N Front St Dowagiac, MI 49047
Estimated Value: $95,362
--
Bed
--
Bath
1,120
Sq Ft
$85/Sq Ft
Est. Value
About This Home
This home is located at 724 N Front St, Dowagiac, MI 49047 and is currently estimated at $95,362, approximately $85 per square foot. 724 N Front St is a home located in Cass County with nearby schools including Justus Gage Elementary School, Dowagiac Middle School, and Union High School.
Ownership History
Date
Name
Owned For
Owner Type
Purchase Details
Closed on
Jun 2, 2019
Sold by
Bravo Valera Investments Llc
Bought by
Borja Jane R
Current Estimated Value
Purchase Details
Closed on
Jan 24, 2019
Sold by
Borja Jane R
Bought by
Bravo Vallera Investments Llc
Purchase Details
Closed on
Dec 3, 2014
Sold by
Ortiz Marcos A and Salazar Sanjuanita
Bought by
Borja Jane R
Purchase Details
Closed on
Apr 26, 2011
Sold by
Chemical Bank
Bought by
Ortiz Marcos A and Salazar Sanjuanita
Create a Home Valuation Report for This Property
The Home Valuation Report is an in-depth analysis detailing your home's value as well as a comparison with similar homes in the area
Home Values in the Area
Average Home Value in this Area
Purchase History
| Date | Buyer | Sale Price | Title Company |
|---|---|---|---|
| Borja Jane R | -- | None Available | |
| Bravo Vallera Investments Llc | $130,000 | None Available | |
| Borja Jane R | $35,000 | None Available | |
| Ortiz Marcos A | $25,000 | Cfc Title Services Inc |
Source: Public Records
Mortgage History
| Date | Status | Borrower | Loan Amount |
|---|---|---|---|
| Closed | Bravo Vallera Investments Llc | $0 |
Source: Public Records
Tax History Compared to Growth
Tax History
| Year | Tax Paid | Tax Assessment Tax Assessment Total Assessment is a certain percentage of the fair market value that is determined by local assessors to be the total taxable value of land and additions on the property. | Land | Improvement |
|---|---|---|---|---|
| 2025 | $4,343 | $80,000 | $17,900 | $62,100 |
| 2024 | $2,071 | $72,600 | $17,400 | $55,200 |
| 2023 | $1,904 | $67,100 | $0 | $0 |
| 2022 | $1,812 | $63,900 | $0 | $0 |
| 2021 | $3,753 | $61,800 | $0 | $0 |
| 2020 | $1,754 | $61,400 | $0 | $0 |
| 2019 | $2,256 | $37,300 | $0 | $0 |
| 2018 | $1,032 | $36,900 | $0 | $0 |
| 2017 | $1,010 | $36,400 | $0 | $0 |
| 2016 | $993 | $35,200 | $0 | $0 |
| 2015 | -- | $34,800 | $0 | $0 |
| 2011 | -- | $43,700 | $0 | $0 |
Source: Public Records
Map
Nearby Homes