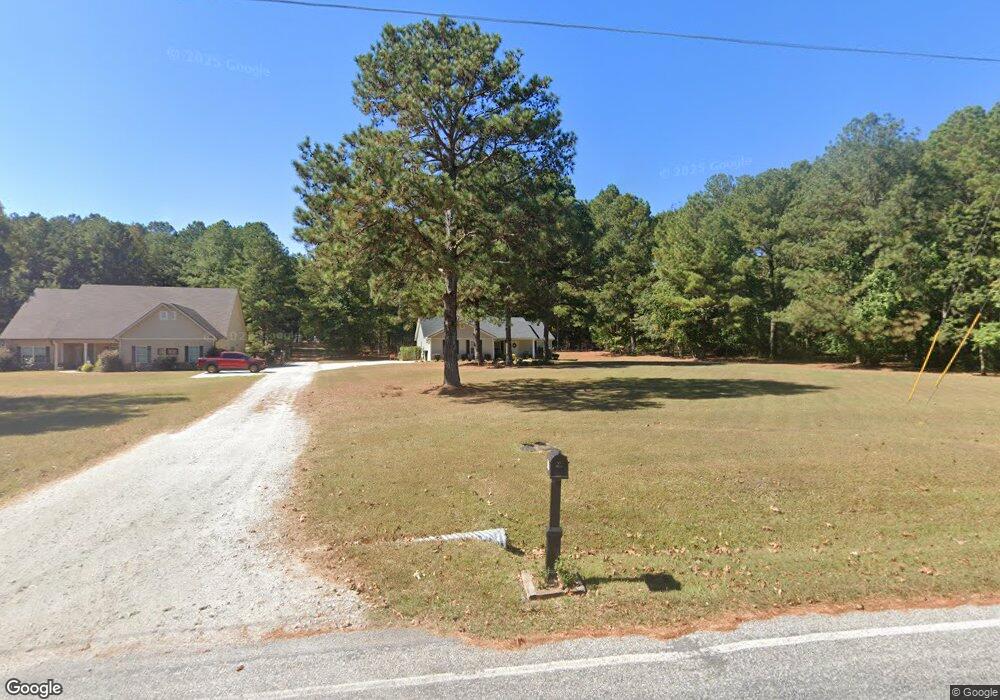
724 Tabby Linch Rd Moreland, GA 30259
Estimated Value: $306,126 - $355,000
3
Beds
2
Baths
1,567
Sq Ft
$215/Sq Ft
Est. Value
About This Home
This home is located at 724 Tabby Linch Rd, Moreland, GA 30259 and is currently estimated at $337,532, approximately $215 per square foot. 724 Tabby Linch Rd is a home located in Coweta County with nearby schools including Moreland Elementary School, Smokey Road Middle School, and Newnan High School.
Ownership History
Date
Name
Owned For
Owner Type
Purchase Details
Closed on
Oct 28, 2022
Sold by
Jackson James M
Bought by
Holloway Robert Cary
Current Estimated Value
Home Financials for this Owner
Home Financials are based on the most recent Mortgage that was taken out on this home.
Original Mortgage
$228,000
Outstanding Balance
$220,428
Interest Rate
6.92%
Mortgage Type
New Conventional
Estimated Equity
$117,104
Purchase Details
Closed on
Sep 15, 2010
Sold by
Synovus Bk
Bought by
Jackson James M and Jackson Alice M
Home Financials for this Owner
Home Financials are based on the most recent Mortgage that was taken out on this home.
Original Mortgage
$60,000
Interest Rate
4.52%
Mortgage Type
New Conventional
Purchase Details
Closed on
Jul 6, 2010
Sold by
Jlj Builders Inc
Bought by
Synovous Bank
Purchase Details
Closed on
Mar 28, 2007
Sold by
Rainwater Kevin Brya
Bought by
Jlj Builders Inc
Purchase Details
Closed on
Jul 26, 1990
Bought by
Rainwater Kevin Brya
Create a Home Valuation Report for This Property
The Home Valuation Report is an in-depth analysis detailing your home's value as well as a comparison with similar homes in the area
Home Values in the Area
Average Home Value in this Area
Purchase History
| Date | Buyer | Sale Price | Title Company |
|---|---|---|---|
| Holloway Robert Cary | $285,000 | -- | |
| Jackson James M | $80,000 | -- | |
| Synovous Bank | $106,996 | -- | |
| Jlj Builders Inc | $66,000 | -- | |
| Rainwater Kevin Brya | -- | -- |
Source: Public Records
Mortgage History
| Date | Status | Borrower | Loan Amount |
|---|---|---|---|
| Open | Holloway Robert Cary | $228,000 | |
| Previous Owner | Jackson James M | $60,000 |
Source: Public Records
Tax History Compared to Growth
Tax History
| Year | Tax Paid | Tax Assessment Tax Assessment Total Assessment is a certain percentage of the fair market value that is determined by local assessors to be the total taxable value of land and additions on the property. | Land | Improvement |
|---|---|---|---|---|
| 2025 | $2,355 | $104,518 | $17,430 | $87,088 |
| 2024 | $2,417 | $108,698 | $16,290 | $92,408 |
| 2023 | $2,417 | $123,182 | $26,396 | $96,787 |
| 2022 | $1,959 | $79,543 | $15,083 | $64,460 |
| 2021 | $1,828 | $69,427 | $14,365 | $55,062 |
| 2020 | $1,840 | $69,427 | $14,365 | $55,062 |
| 2019 | $1,448 | $49,466 | $11,648 | $37,818 |
| 2018 | $1,450 | $49,466 | $11,648 | $37,818 |
| 2017 | $1,450 | $49,466 | $11,648 | $37,818 |
| 2016 | $1,433 | $49,466 | $11,648 | $37,818 |
| 2015 | $1,408 | $49,466 | $11,648 | $37,818 |
| 2014 | $1,397 | $49,466 | $11,648 | $37,818 |
Source: Public Records
Map
Nearby Homes
- 92 Gordon Oaks Way
- 1495 Martin Mill Rd
- 30 Linton Estates Ave
- 885 Alex Stephens Rd Unit LOT 1
- 837 Alex Stephens Rd Unit 2
- 757 Alex Stephens Rd Unit 5
- 743 Alex Stephens Rd Unit LOT 6
- 779 Alex Stephens Rd Unit LOT 4
- 803 Alex Stephens Rd Unit LOT 3
- 0 Teasley Trail Unit 10600969
- 2784 Martin Mill Rd
- 74 Kindelwood Dr Unit LOT 3
- 2725 Gordon Rd
- 59 Akers Lake Dr
- 145 E Camp St
- 188 Ball St
- 215 Grey Fairs Ave
- 1234 Haynie Rd
- 8 Cameron St
- 15 Couch St
- 724 Tabby Linch Rd Unit LOT 1
- 720 Tabby Linch Rd
- 720 Tabby Linch Rd Unit 126
- 704 Tabby Linch Rd
- 744 Tabby Linch Rd
- 722 Tabby Linch Rd
- 715 Tabby Linch Rd
- 737 Tabby Linch Rd
- 678 Tabby Linch Rd
- 672 Tabby Linch Rd
- 1565 Gordon Rd
- 664 Tabby Linch Rd
- 1427 Gordon Rd
- 650 Tabby Linch Rd
- 668 Tabby Linch Rd
- 675 Tabby Linch Rd
- 1443 Gordon Rd
- 1705 Gordon Rd
- 1680 Gordon Rd
- 1644 Gordon Rd