724 Tossa de Mar Ave Henderson, NV 89002
Paradise Hills NeighborhoodEstimated Value: $521,847 - $536,000
3
Beds
2
Baths
2,053
Sq Ft
$257/Sq Ft
Est. Value
About This Home
This home is located at 724 Tossa de Mar Ave, Henderson, NV 89002 and is currently estimated at $527,712, approximately $257 per square foot. 724 Tossa de Mar Ave is a home located in Clark County with nearby schools including J. Marlan Walker International School, Jack & Terry Mannion Middle School, and Foothill High School.
Ownership History
Date
Name
Owned For
Owner Type
Purchase Details
Closed on
Jul 7, 2015
Sold by
Klessing Randall
Bought by
Woodrum Thomas A
Current Estimated Value
Home Financials for this Owner
Home Financials are based on the most recent Mortgage that was taken out on this home.
Original Mortgage
$228,000
Outstanding Balance
$177,594
Interest Rate
3.83%
Mortgage Type
New Conventional
Estimated Equity
$350,118
Purchase Details
Closed on
Apr 22, 2015
Sold by
Klessig Cherie and Klessig Randall
Bought by
Klessig Randall
Purchase Details
Closed on
Nov 3, 2008
Sold by
Klessig Cherie
Bought by
Klessig Cherie and Klessig Randall
Purchase Details
Closed on
Feb 21, 2003
Sold by
Klessig Dennis James and Klessig Cherie
Bought by
Klessig Cherie
Home Financials for this Owner
Home Financials are based on the most recent Mortgage that was taken out on this home.
Original Mortgage
$184,812
Interest Rate
5.89%
Create a Home Valuation Report for This Property
The Home Valuation Report is an in-depth analysis detailing your home's value as well as a comparison with similar homes in the area
Home Values in the Area
Average Home Value in this Area
Purchase History
| Date | Buyer | Sale Price | Title Company |
|---|---|---|---|
| Woodrum Thomas A | $285,000 | Nevada Title Las Vegas | |
| Klessig Randall | -- | None Available | |
| Klessig Cherie | -- | None Available | |
| Klessig Cherie | $221,590 | Commerce Title Insurance Co | |
| Klessig Cherie | $221,590 | Commerce Title Insurance Co |
Source: Public Records
Mortgage History
| Date | Status | Borrower | Loan Amount |
|---|---|---|---|
| Open | Woodrum Thomas A | $228,000 | |
| Previous Owner | Klessig Cherie | $184,812 |
Source: Public Records
Tax History Compared to Growth
Tax History
| Year | Tax Paid | Tax Assessment Tax Assessment Total Assessment is a certain percentage of the fair market value that is determined by local assessors to be the total taxable value of land and additions on the property. | Land | Improvement |
|---|---|---|---|---|
| 2025 | $2,513 | $129,606 | $37,450 | $92,156 |
| 2024 | $2,440 | $129,606 | $37,450 | $92,156 |
| 2023 | $2,440 | $133,454 | $46,550 | $86,904 |
| 2022 | $2,369 | $121,500 | $42,000 | $79,500 |
| 2021 | $2,300 | $110,285 | $34,650 | $75,635 |
| 2020 | $2,230 | $107,422 | $32,550 | $74,872 |
| 2019 | $2,165 | $102,256 | $28,700 | $73,556 |
| 2018 | $2,102 | $93,967 | $23,100 | $70,867 |
| 2017 | $2,648 | $91,271 | $23,100 | $68,171 |
| 2016 | $1,991 | $83,543 | $17,150 | $66,393 |
| 2015 | $1,985 | $71,691 | $12,600 | $59,091 |
| 2014 | $1,924 | $64,403 | $11,550 | $52,853 |
Source: Public Records
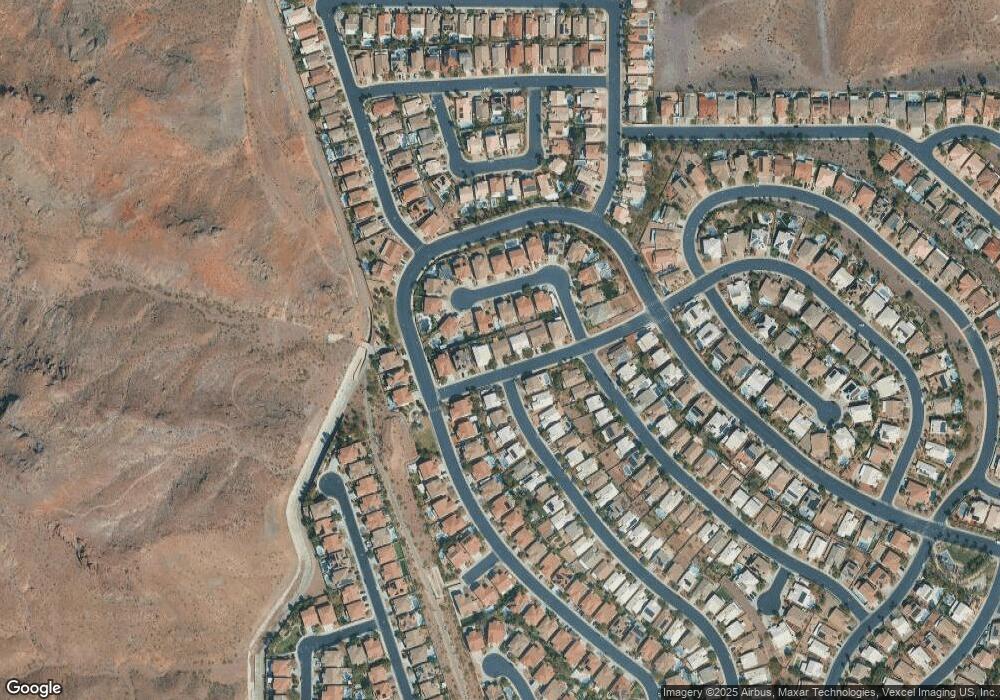
Map
Nearby Homes
- 70 Blaven Dr Unit 5
- 701 Jane Eyre Place
- 787 Craigmark Ct
- 96 Saint Johns Wood Ave
- 719 Descartes Ave
- 780 Vortex Ave
- 43 Pangloss St
- 0 E Mission Dr
- 730 Descartes Ave
- 815 Sun Bridge Ln
- 87 Rattlesnake Grass Ct
- 1044 Spanish Needle St
- 110 Mint Orchard Dr
- 107 Mint Orchard Dr
- 805 Blue Springs Dr
- 837 Holly Lake Way
- 128 Rancho Maderas Way
- 131 Park Ridge Ln
- 736 Yellowtail Way
- 0 N San Gregorio Cir
- 722 Tossa de Mar Ave Unit 5
- 95 Blaven Dr
- 93 Blaven Dr
- 728 Tossa de Mar Ave
- 91 Blaven Dr
- 744 Wigan Pier Dr Unit 5
- 97 Blaven Dr
- 743 Wigan Pier Dr Unit 5
- 730 Tossa de Mar Ave Unit 5
- 718 Tossa de Mar Ave
- 89 Blaven Dr
- 746 Wigan Pier Dr Unit 5
- 745 Wigan Pier Dr
- 97 Voltaire Ave
- 73 Blaven Dr Unit 5
- 99 Blaven Dr
- 748 Wigan Pier Dr
- 748 Wigan Pier Dr Unit Drive
- 94 Blaven Dr
- 99 Voltaire Ave