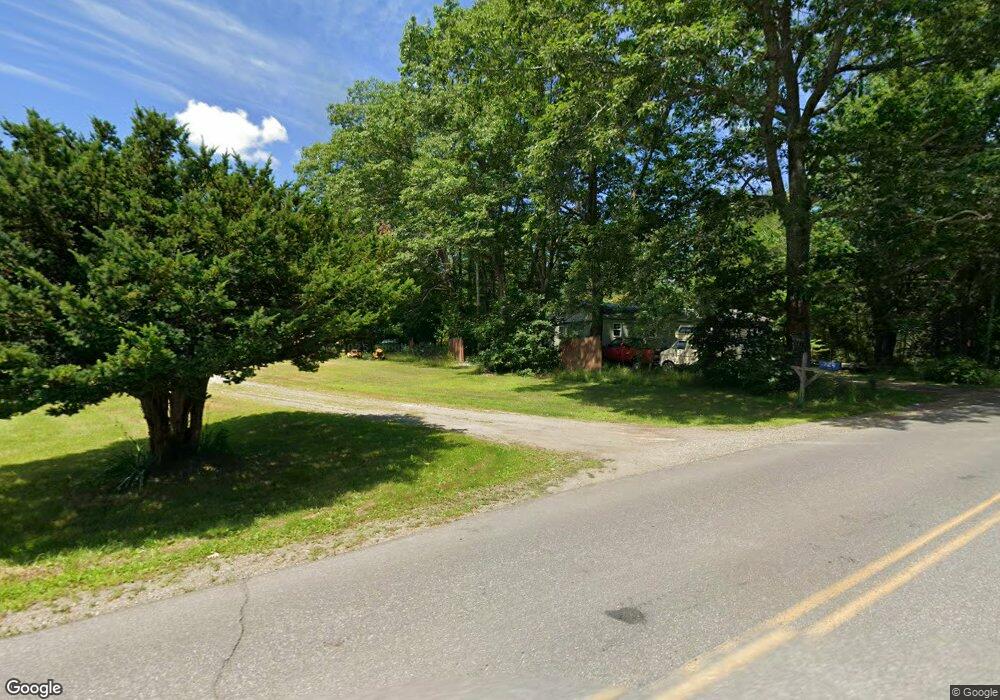
724 Vigue Rd Windsor, ME 04363
Estimated Value: $310,000 - $443,572
3
Beds
2
Baths
1,898
Sq Ft
$197/Sq Ft
Est. Value
About This Home
This home is located at 724 Vigue Rd, Windsor, ME 04363 and is currently estimated at $373,143, approximately $196 per square foot. 724 Vigue Rd is a home located in Kennebec County with nearby schools including Windsor Elementary School.
Ownership History
Date
Name
Owned For
Owner Type
Purchase Details
Closed on
Oct 17, 2019
Sold by
Boudreau Sherry L
Bought by
Boudreau Joshua M and Spieldenner Mary E
Current Estimated Value
Home Financials for this Owner
Home Financials are based on the most recent Mortgage that was taken out on this home.
Original Mortgage
$180,000
Outstanding Balance
$156,659
Interest Rate
3.4%
Mortgage Type
New Conventional
Estimated Equity
$216,484
Purchase Details
Closed on
Sep 20, 2017
Sold by
Boudreau Sherry
Bought by
Schopmann Jean
Home Financials for this Owner
Home Financials are based on the most recent Mortgage that was taken out on this home.
Original Mortgage
$45,000
Interest Rate
3.9%
Mortgage Type
New Conventional
Create a Home Valuation Report for This Property
The Home Valuation Report is an in-depth analysis detailing your home's value as well as a comparison with similar homes in the area
Home Values in the Area
Average Home Value in this Area
Purchase History
| Date | Buyer | Sale Price | Title Company |
|---|---|---|---|
| Boudreau Joshua M | -- | -- | |
| Boudreau Joshua M | -- | -- | |
| Boudreau Joshua M | -- | -- | |
| Boudreau Joshua M | -- | -- | |
| Schopmann Jean | -- | -- | |
| Schopmann Jean | -- | -- | |
| Schopmann Jean | -- | -- |
Source: Public Records
Mortgage History
| Date | Status | Borrower | Loan Amount |
|---|---|---|---|
| Open | Boudreau Joshua M | $180,000 | |
| Closed | Boudreau Joshua M | $180,000 | |
| Previous Owner | Schopmann Jean | $45,000 |
Source: Public Records
Tax History
| Year | Tax Paid | Tax Assessment Tax Assessment Total Assessment is a certain percentage of the fair market value that is determined by local assessors to be the total taxable value of land and additions on the property. | Land | Improvement |
|---|---|---|---|---|
| 2024 | $3,300 | $358,700 | $45,200 | $313,500 |
| 2023 | $2,700 | $186,200 | $25,400 | $160,800 |
| 2022 | $2,551 | $186,200 | $25,400 | $160,800 |
| 2021 | $2,421 | $186,200 | $25,400 | $160,800 |
| 2020 | $2,383 | $186,200 | $25,400 | $160,800 |
| 2019 | $2,670 | $210,200 | $49,400 | $160,800 |
| 2018 | $2,712 | $210,200 | $49,400 | $160,800 |
| 2017 | $2,757 | $215,400 | $54,600 | $160,800 |
| 2016 | $2,736 | $215,400 | $54,600 | $160,800 |
| 2015 | $2,563 | $215,400 | $54,600 | $160,800 |
| 2014 | $3,089 | $237,600 | $54,600 | $183,000 |
| 2013 | $3,136 | $237,600 | $54,600 | $183,000 |
Source: Public Records
Map
Nearby Homes
- 768 Augusta-Rockland Rd
- 168 Main St
- 286 Doyle Rd
- 292 Doyle Rd
- 10 Ridge Rd
- 295 Coopers Mills Rd
- 176 Vigue Rd
- 24 Stone House Ct
- 24 Penny Ln
- 23 Penny Ln
- 214 Augusta Rockland Rd
- Lot 1 Woody Ln
- Lot 5 Woody Ln
- Lot 2 Woody Ln
- Lot 4 Woody Ln
- Lot 3 Woody Ln
- Off Munsey Rd
- 3 Elmwood Ave
- 20 Pitt Rd
- 448 Cooper Rd
Your Personal Tour Guide
Ask me questions while you tour the home.