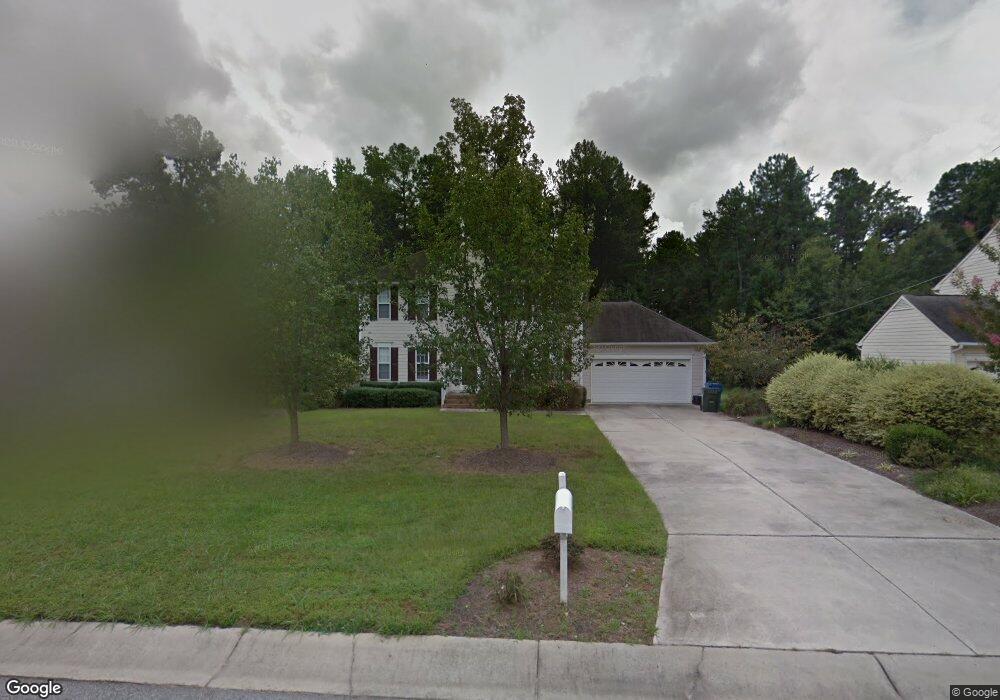
724 Windcrest Rd Durham, NC 27713
South Durham NeighborhoodEstimated Value: $443,512 - $468,000
3
Beds
3
Baths
1,889
Sq Ft
$242/Sq Ft
Est. Value
About This Home
This home is located at 724 Windcrest Rd, Durham, NC 27713 and is currently estimated at $457,378, approximately $242 per square foot. 724 Windcrest Rd is a home located in Durham County with nearby schools including Pearsontown Elementary School, Lowe's Grove Middle, and Hillside High School.
Ownership History
Date
Name
Owned For
Owner Type
Purchase Details
Closed on
Apr 26, 2017
Sold by
Bowen Jessie E
Bought by
Izaguirre Lenin and Cortes Pineda Angie Maria
Current Estimated Value
Home Financials for this Owner
Home Financials are based on the most recent Mortgage that was taken out on this home.
Original Mortgage
$245,000
Outstanding Balance
$205,943
Interest Rate
4.5%
Mortgage Type
New Conventional
Estimated Equity
$251,435
Purchase Details
Closed on
Jan 14, 2000
Sold by
Cynmar Designs Inc
Bought by
Bowen Jessie E
Home Financials for this Owner
Home Financials are based on the most recent Mortgage that was taken out on this home.
Original Mortgage
$148,900
Interest Rate
6.87%
Purchase Details
Closed on
Mar 22, 1999
Sold by
Crooked Creek Llc
Bought by
Cynmar Designs Inc
Home Financials for this Owner
Home Financials are based on the most recent Mortgage that was taken out on this home.
Original Mortgage
$126,000
Interest Rate
6.74%
Create a Home Valuation Report for This Property
The Home Valuation Report is an in-depth analysis detailing your home's value as well as a comparison with similar homes in the area
Home Values in the Area
Average Home Value in this Area
Purchase History
| Date | Buyer | Sale Price | Title Company |
|---|---|---|---|
| Izaguirre Lenin | $243,000 | -- | |
| Bowen Jessie E | $169,000 | -- | |
| Cynmar Designs Inc | $31,000 | -- |
Source: Public Records
Mortgage History
| Date | Status | Borrower | Loan Amount |
|---|---|---|---|
| Open | Izaguirre Lenin | $245,000 | |
| Previous Owner | Bowen Jessie E | $148,900 | |
| Previous Owner | Cynmar Designs Inc | $126,000 |
Source: Public Records
Tax History
| Year | Tax Paid | Tax Assessment Tax Assessment Total Assessment is a certain percentage of the fair market value that is determined by local assessors to be the total taxable value of land and additions on the property. | Land | Improvement |
|---|---|---|---|---|
| 2025 | $4,651 | $469,136 | $146,000 | $323,136 |
| 2024 | $3,532 | $253,204 | $54,600 | $198,604 |
| 2023 | $3,317 | $253,204 | $54,600 | $198,604 |
| 2022 | $3,241 | $253,204 | $54,600 | $198,604 |
| 2021 | $3,226 | $253,204 | $54,600 | $198,604 |
| 2020 | $3,150 | $253,204 | $54,600 | $198,604 |
| 2019 | $3,150 | $253,204 | $54,600 | $198,604 |
| 2018 | $3,197 | $235,706 | $36,400 | $199,306 |
| 2017 | $3,174 | $235,706 | $36,400 | $199,306 |
| 2016 | $3,067 | $235,706 | $36,400 | $199,306 |
| 2015 | $3,993 | $288,436 | $38,189 | $250,247 |
| 2014 | $3,993 | $288,436 | $38,189 | $250,247 |
Source: Public Records
Map
Nearby Homes
- 8 Drummond Ct
- 63 Lake Village Dr
- 1058 Flagler St
- 1062 Flagler St
- 3105 Dunnock Dr
- 515 Wellingham Dr
- 6519 Amber Springs Dr
- 6500 Amber Springs Dr
- 6004 Tahoe Dr
- 1001 Pebble Creek Crossing Unit 11
- 1129 Pebble Creek Crossing
- 1101 Canary Pepper Dr
- 6502 Barbee Rd
- 32 Brafferton Ct
- 5624 Barbee Rd
- 1 Chownings St
- 620 Wellingham Dr
- 1107 Rocketcress Dr
- 1049 Laceflower Dr
- 1038 Laceflower Dr
- 722 Windcrest Rd
- 726 Windcrest Rd
- 720 Windcrest Rd
- 6120 Castell Dr
- 718 Windcrest Rd
- 6114 Castell Dr
- 2 Windcourt Place
- 6108 Castell Dr
- 713 Windcrest Rd
- 715 Windcrest Rd
- 716 Windcrest Rd
- 6102 Castell Dr
- 6124 Castell Dr
- 717 Windcrest Rd
- 714 Windcrest Rd
- 721 Windcrest Rd
- 6126 Castell Dr
- 712 Windcrest Rd
- 6 Windcourt Place
- 523 Wheeling Cir
Your Personal Tour Guide
Ask me questions while you tour the home.