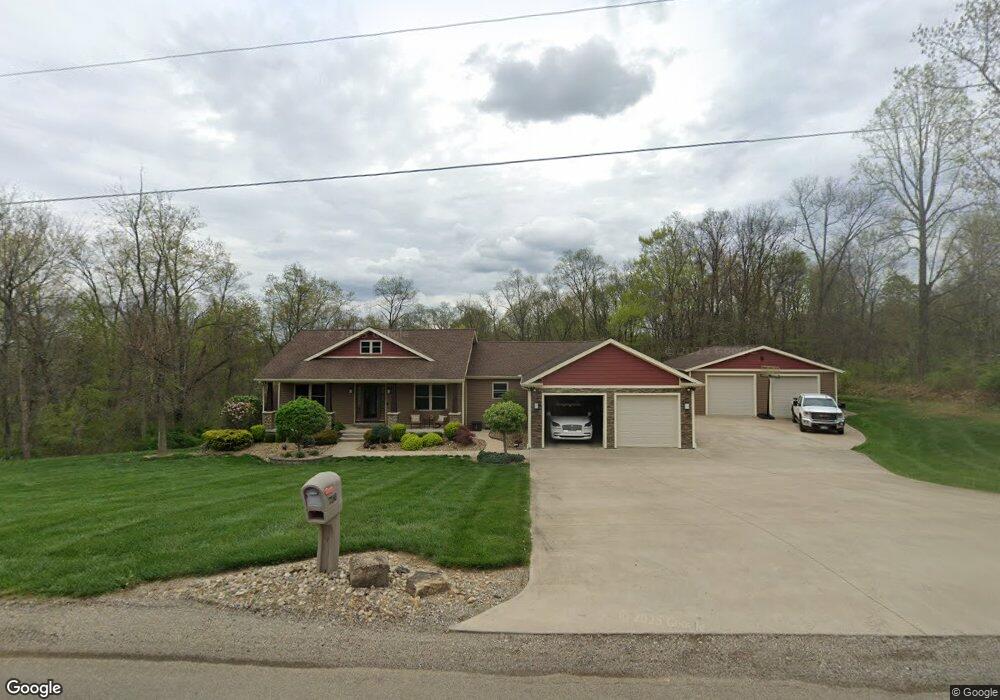
7240 Jones Rd Nashport, OH 43830
Estimated Value: $377,000 - $671,645
3
Beds
3
Baths
1,960
Sq Ft
$269/Sq Ft
Est. Value
About This Home
This home is located at 7240 Jones Rd, Nashport, OH 43830 and is currently estimated at $527,161, approximately $268 per square foot. 7240 Jones Rd is a home located in Muskingum County with nearby schools including Tri-Valley High School.
Ownership History
Date
Name
Owned For
Owner Type
Purchase Details
Closed on
Jun 21, 2013
Sold by
Nauer David and Nauer Tasia
Bought by
Stubbs Justin and Stubbs Brittany
Current Estimated Value
Purchase Details
Closed on
Jul 28, 2010
Sold by
Rapol Douglas R and Rapol Angela L
Bought by
Nauer David and Nauer Tasia
Purchase Details
Closed on
Dec 6, 2006
Sold by
C I Development Llc
Bought by
Rapol Douglas R and Rapol Angela L
Home Financials for this Owner
Home Financials are based on the most recent Mortgage that was taken out on this home.
Original Mortgage
$33,500
Interest Rate
6.62%
Mortgage Type
Purchase Money Mortgage
Purchase Details
Closed on
Jul 2, 2003
Sold by
C I Development Llc
Bought by
Wetzel Robert E and Wetzel Victoria A
Purchase Details
Closed on
Dec 31, 2002
Sold by
Goff Carol
Bought by
C I Dev Llc
Home Financials for this Owner
Home Financials are based on the most recent Mortgage that was taken out on this home.
Original Mortgage
$230,000
Interest Rate
6.01%
Mortgage Type
New Conventional
Create a Home Valuation Report for This Property
The Home Valuation Report is an in-depth analysis detailing your home's value as well as a comparison with similar homes in the area
Home Values in the Area
Average Home Value in this Area
Purchase History
| Date | Buyer | Sale Price | Title Company |
|---|---|---|---|
| Stubbs Justin | $40,000 | None Available | |
| Nauer David | $38,500 | Attorney | |
| Rapol Douglas R | $33,500 | Attorney | |
| Wetzel Robert E | $27,500 | -- | |
| C I Dev Llc | $285,000 | -- |
Source: Public Records
Mortgage History
| Date | Status | Borrower | Loan Amount |
|---|---|---|---|
| Previous Owner | Rapol Douglas R | $33,500 | |
| Previous Owner | C I Dev Llc | $230,000 |
Source: Public Records
Tax History Compared to Growth
Tax History
| Year | Tax Paid | Tax Assessment Tax Assessment Total Assessment is a certain percentage of the fair market value that is determined by local assessors to be the total taxable value of land and additions on the property. | Land | Improvement |
|---|---|---|---|---|
| 2024 | $5,066 | $152,215 | $25,410 | $126,805 |
| 2023 | $4,234 | $118,370 | $15,015 | $103,355 |
| 2022 | $4,120 | $118,370 | $15,015 | $103,355 |
| 2021 | $4,147 | $118,370 | $15,015 | $103,355 |
| 2020 | $3,675 | $102,935 | $13,055 | $89,880 |
| 2019 | $3,675 | $102,935 | $13,055 | $89,880 |
| 2018 | $3,230 | $99,435 | $13,055 | $86,380 |
| 2017 | $2,937 | $77,035 | $13,055 | $63,980 |
| 2016 | $2,783 | $77,040 | $13,060 | $63,980 |
| 2015 | $2,856 | $77,040 | $13,060 | $63,980 |
| 2013 | $506 | $11,900 | $11,900 | $0 |
Source: Public Records
Map
Nearby Homes
- 7360 Jones Rd
- 6705 Frazeysburd Rd
- 6705 Frazeysburg Rd
- 2760 Kenlo Woods Dr
- 2505 Kenlo Woods Dr
- 3755 Gorsuch Rd
- 2871 Sams Way
- 6180 Arnies Dr
- 3865 Creamery Rd
- 6008 Shala Cir
- 0 Vista View Dr Unit 23429766
- 4321 Creamery Rd
- 9520 McGlade School Rd
- 2610 Chardon Rd
- 0 Newark Rd
- 1560 Coachlite Cir
- 1650 Richvale Rd
- 0 Maplecreek Dr Unit 5128078
- 0 Maplecreek Dr Unit 224024720
- 3695 Hayfield Rd
- 7230 Jones Rd
- 0 Jones Rd
- 7190 Jones Rd
- 7215 Jones Rd
- 7260 Jones Rd
- 7265 Jones Rd
- 7295 Cassies Way
- 7050 Jones Rd
- 7285 Cassies Way
- 7045 Jones Rd
- 7305 Cassies Way
- 7300 Jones Rd
- 7275 Cassies Way
- 7315 Cassies Way
- 7265 Cassies Way
- 7300 Cassies Way
- 7025 Jones Rd
- 7290 Cassies Way
- 7320 Jones Rd
- 7280 Cassies Way