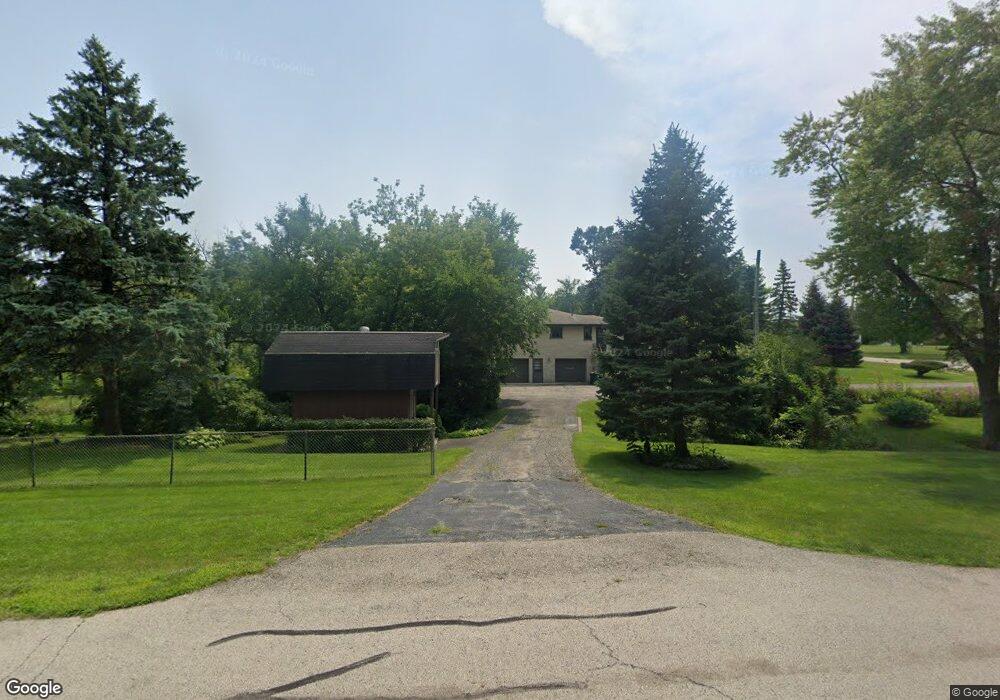
7240 Rfd Long Grove, IL 60060
Estimated Value: $935,000 - $1,021,000
Studio
6
Baths
3,909
Sq Ft
$249/Sq Ft
Est. Value
About This Home
This home is located at 7240 Rfd, Long Grove, IL 60060 and is currently estimated at $974,115, approximately $249 per square foot. 7240 Rfd is a home located in Lake County with nearby schools including Diamond Lake Elementary School, West Oak Middle School, and Adlai E Stevenson High School.
Ownership History
Date
Name
Owned For
Owner Type
Purchase Details
Closed on
May 18, 2023
Sold by
Ci Ning
Bought by
Tsie-Yun Shaw Trust
Current Estimated Value
Purchase Details
Closed on
Feb 11, 2015
Sold by
Shen Jie and Ci Ning
Bought by
Ci Ning
Purchase Details
Closed on
Aug 14, 2014
Sold by
Shen Jie and Ci Ning
Bought by
Shen Jie and Ci Ning
Purchase Details
Closed on
Jun 12, 2012
Sold by
Spaven Kerry J and Spaven Frances
Bought by
Shen Jie and Ci Ning
Purchase Details
Closed on
Mar 27, 2007
Sold by
Markaryan Yegishe
Bought by
Spaven Kerry J and Spaven Frances
Home Financials for this Owner
Home Financials are based on the most recent Mortgage that was taken out on this home.
Original Mortgage
$675,000
Interest Rate
6.2%
Mortgage Type
Purchase Money Mortgage
Purchase Details
Closed on
Jul 25, 2005
Sold by
Fidelity Wes Of Ravenna Llc
Bought by
Markaryan Yegishe
Home Financials for this Owner
Home Financials are based on the most recent Mortgage that was taken out on this home.
Original Mortgage
$200,000
Interest Rate
5.93%
Mortgage Type
Fannie Mae Freddie Mac
Create a Home Valuation Report for This Property
The Home Valuation Report is an in-depth analysis detailing your home's value as well as a comparison with similar homes in the area
Home Values in the Area
Average Home Value in this Area
Purchase History
| Date | Buyer | Sale Price | Title Company |
|---|---|---|---|
| Tsie-Yun Shaw Trust | $870,000 | Proper Title | |
| Ci Ning | -- | None Available | |
| Shen Jie | -- | None Available | |
| Shen Jie | $727,500 | Baird & Waner Title Services | |
| Spaven Kerry J | $1,065,000 | None Available | |
| Markaryan Yegishe | $250,000 | First American Title |
Source: Public Records
Mortgage History
| Date | Status | Borrower | Loan Amount |
|---|---|---|---|
| Previous Owner | Spaven Kerry J | $675,000 | |
| Previous Owner | Markaryan Yegishe | $200,000 |
Source: Public Records
Tax History
| Year | Tax Paid | Tax Assessment Tax Assessment Total Assessment is a certain percentage of the fair market value that is determined by local assessors to be the total taxable value of land and additions on the property. | Land | Improvement |
|---|---|---|---|---|
| 2024 | $22,533 | $250,222 | $38,009 | $212,213 |
| 2023 | $22,314 | $236,103 | $35,864 | $200,239 |
| 2022 | $22,314 | $228,335 | $34,684 | $193,651 |
| 2021 | $21,558 | $225,873 | $34,310 | $191,563 |
| 2020 | $21,274 | $226,644 | $34,427 | $192,217 |
| 2019 | $22,374 | $241,643 | $34,300 | $207,343 |
| 2018 | $23,235 | $253,915 | $37,286 | $216,629 |
| 2017 | $22,919 | $247,988 | $36,416 | $211,572 |
| 2016 | $22,256 | $237,468 | $34,871 | $202,597 |
| 2015 | $21,742 | $222,078 | $32,611 | $189,467 |
| 2014 | $20,131 | $208,823 | $35,025 | $173,798 |
| 2012 | $18,263 | $209,241 | $35,095 | $174,146 |
Source: Public Records
Map
Nearby Homes
- 7271 Providence Ct
- 7298 Claridge Ct
- 427 E Il Route 83
- 911 Ann Arbor Ln Unit 253
- 559 Yosemite Way
- 557 Yosemite Way
- 555 Yosemite Way
- 553 Yosemite Way
- 551 Yosemite Way
- 569 Yosemite Way
- 567 Yosemite Way
- 565 Yosemite Way
- 563 Yosemite Way
- 561 Yosemite Way
- 575 Yosemite Way
- 571 Yosemite Way
- 883 Sparta Ct Unit 64
- 615 Grosse Pointe Cir Unit 127
- 585 Yosemite Way
- 543 Grosse Pointe Cir Unit 103
Your Personal Tour Guide
Ask me questions while you tour the home.