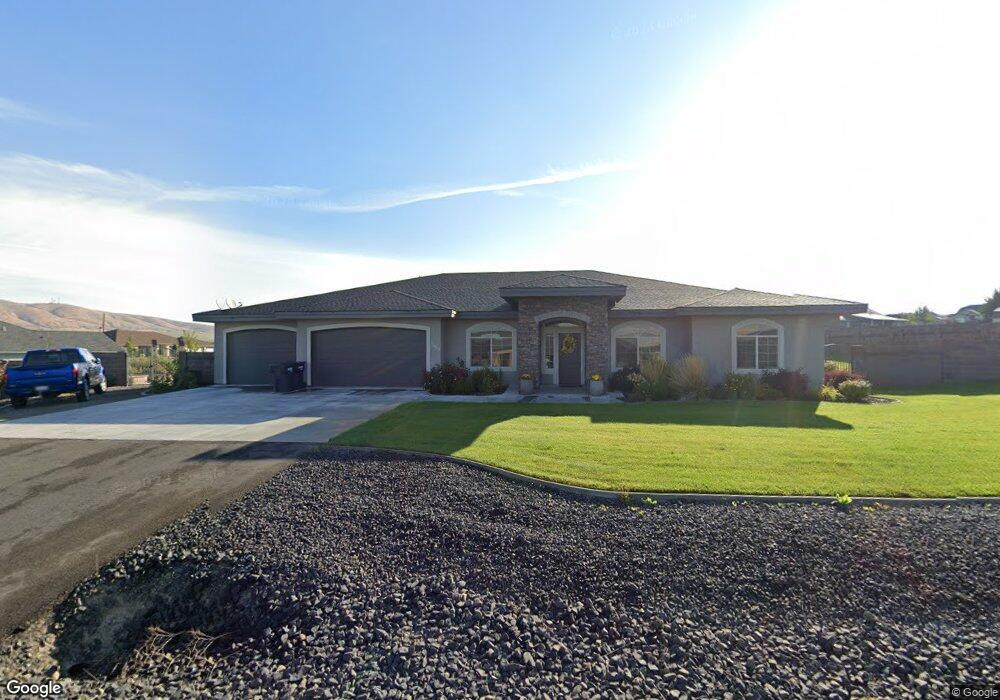
72404 E Reata Rd Unit The Texan Kennewick, WA 99338
Estimated Value: $783,000 - $851,000
4
Beds
3
Baths
3,057
Sq Ft
$266/Sq Ft
Est. Value
About This Home
This home is located at 72404 E Reata Rd Unit The Texan, Kennewick, WA 99338 and is currently estimated at $811,697, approximately $265 per square foot. 72404 E Reata Rd Unit The Texan is a home located in Benton County with nearby schools including Cottonwood Elementary School, Desert Hills Middle School, and Kamiakin High School.
Ownership History
Date
Name
Owned For
Owner Type
Purchase Details
Closed on
Jul 23, 2020
Sold by
Kirby Jason and Kirby Amber
Bought by
Stordahl Duslin J and Stordahl Bristi R
Current Estimated Value
Home Financials for this Owner
Home Financials are based on the most recent Mortgage that was taken out on this home.
Original Mortgage
$476,000
Outstanding Balance
$422,868
Interest Rate
3.2%
Mortgage Type
New Conventional
Estimated Equity
$388,829
Purchase Details
Closed on
Jun 29, 2016
Sold by
Riverwood Homes Inc
Bought by
Kirby Jason and Kirby Amber
Home Financials for this Owner
Home Financials are based on the most recent Mortgage that was taken out on this home.
Original Mortgage
$464,284
Interest Rate
3.64%
Mortgage Type
VA
Purchase Details
Closed on
Jan 29, 2015
Sold by
Tri City Development Corporation
Bought by
Riverwood Homes Inc
Create a Home Valuation Report for This Property
The Home Valuation Report is an in-depth analysis detailing your home's value as well as a comparison with similar homes in the area
Home Values in the Area
Average Home Value in this Area
Purchase History
| Date | Buyer | Sale Price | Title Company |
|---|---|---|---|
| Stordahl Duslin J | $511,432 | Chicago Title Company Of Wa | |
| Kirby Jason | -- | Cascade Title Company | |
| Riverwood Homes Inc | $53,871 | Chicago Title |
Source: Public Records
Mortgage History
| Date | Status | Borrower | Loan Amount |
|---|---|---|---|
| Open | Stordahl Duslin J | $476,000 | |
| Previous Owner | Kirby Jason | $464,284 |
Source: Public Records
Tax History Compared to Growth
Tax History
| Year | Tax Paid | Tax Assessment Tax Assessment Total Assessment is a certain percentage of the fair market value that is determined by local assessors to be the total taxable value of land and additions on the property. | Land | Improvement |
|---|---|---|---|---|
| 2024 | $7,013 | $781,780 | $170,000 | $611,780 |
| 2023 | $7,013 | $781,780 | $170,000 | $611,780 |
| 2022 | $6,390 | $637,850 | $70,000 | $567,850 |
| 2021 | $5,791 | $587,750 | $70,000 | $517,750 |
| 2020 | $5,637 | $520,940 | $70,000 | $450,940 |
| 2019 | $5,273 | $487,540 | $70,000 | $417,540 |
| 2018 | $5,442 | $470,840 | $70,000 | $400,840 |
| 2017 | $4,834 | $404,030 | $70,000 | $334,030 |
| 2016 | $740 | $387,690 | $58,000 | $329,690 |
| 2015 | -- | $58,000 | $58,000 | $0 |
| 2014 | -- | $0 | $0 | $0 |
Source: Public Records
Map
Nearby Homes
- 72502 E Reata Rd
- 1605 S 717 Prairie SE
- 114 727 Prairie SE
- 72905 E Grand Bluff Loop
- 4827 Village View St
- 4204 S Coulee Vista Dr
- 2573 Brodie Ln
- 4808 Harlan Ct
- 74303 E Grand Bluff Loop
- 4629 Village View St
- 4801 White Dr
- 2504 Brodie Ln
- 2613 Morris Ave
- 71421 E Sundown Prairie SE
- 4707 Jodie St
- NKA Dallas Rd (A1)
- 5026 Smitty Dr
- 4708 Jodie St
- NKA Dallas Rd (A2)
- 4951 Smitty Dr
- 72404 E Reata Rd
- 72502 E Reata Rd Unit Riverwood Homes
- 1002 Coulee Vista Dr
- 602 S Coulee Vista Dr
- 72403 E Reata Rd
- 72503 E Reata Rd
- 72305 E Reata Rd
- 72804 Landon Ln
- 72804 Landon Ln Unit Room for a Shop and
- 72804 Landon Ln Unit CUSTOM HOME W/2ND SU
- 72804 Landon Ln Unit Don't let this one g
- 1404 Coulee Vista Dr
- 603 Coulee Vista Dr
- 705 Coulee Vista Dr
- 705 Coulee Vista Dr Unit Spectacular Titan Ho
- 72605 E Reata Rd
- 72605 E Reata Rd Unit Rambler with BR on .
- 1005 Coulee Vista Dr
- 1005 Coulee Vista Dr Unit Pre-Sale
- 404 727 Prairie SE