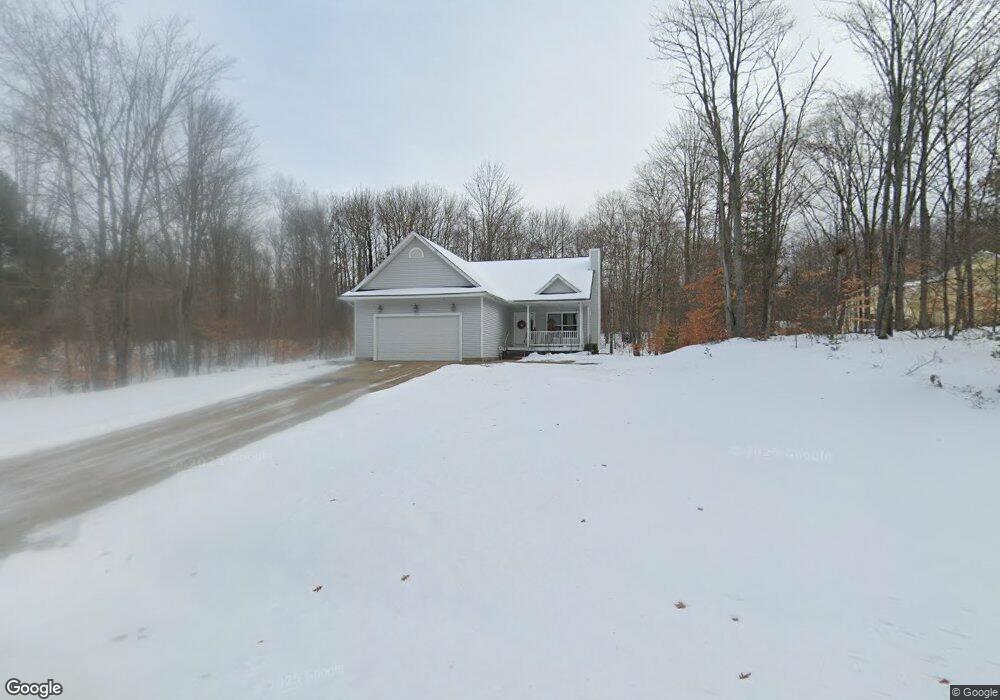
7241 Bob White Way Gaylord, MI 49735
Estimated Value: $317,804 - $365,000
3
Beds
2
Baths
2,780
Sq Ft
$122/Sq Ft
Est. Value
About This Home
This home is located at 7241 Bob White Way, Gaylord, MI 49735 and is currently estimated at $339,951, approximately $122 per square foot. 7241 Bob White Way is a home located in Otsego County with nearby schools including South Maple Elementary School, Gaylord Intermediate School, and Gaylord Middle School.
Ownership History
Date
Name
Owned For
Owner Type
Purchase Details
Closed on
Jan 12, 2011
Sold by
Fannie Mae
Bought by
Thorp Joseph W
Current Estimated Value
Home Financials for this Owner
Home Financials are based on the most recent Mortgage that was taken out on this home.
Original Mortgage
$99,200
Outstanding Balance
$67,761
Interest Rate
4.82%
Estimated Equity
$272,190
Purchase Details
Closed on
Feb 25, 2010
Sold by
Otsego County
Bought by
Federal National Mortgage Association
Purchase Details
Closed on
Jan 30, 2008
Sold by
Kirby John Scott and Kirby Lori
Bought by
Hall Chad D and Hall Virginia F
Home Financials for this Owner
Home Financials are based on the most recent Mortgage that was taken out on this home.
Original Mortgage
$215,000
Interest Rate
6.11%
Purchase Details
Closed on
Aug 10, 2007
Sold by
Eliason Dennis D and Eliason Barbara A
Bought by
Kirby John Scott
Create a Home Valuation Report for This Property
The Home Valuation Report is an in-depth analysis detailing your home's value as well as a comparison with similar homes in the area
Home Values in the Area
Average Home Value in this Area
Purchase History
| Date | Buyer | Sale Price | Title Company |
|---|---|---|---|
| Thorp Joseph W | $124,000 | -- | |
| Federal National Mortgage Association | $222,577 | -- | |
| Hall Chad D | $220,042 | -- | |
| Kirby John Scott | $3,500 | -- |
Source: Public Records
Mortgage History
| Date | Status | Borrower | Loan Amount |
|---|---|---|---|
| Open | Thorp Joseph W | $99,200 | |
| Previous Owner | Hall Chad D | $215,000 |
Source: Public Records
Tax History Compared to Growth
Tax History
| Year | Tax Paid | Tax Assessment Tax Assessment Total Assessment is a certain percentage of the fair market value that is determined by local assessors to be the total taxable value of land and additions on the property. | Land | Improvement |
|---|---|---|---|---|
| 2025 | $1,699 | $169,900 | $0 | $0 |
| 2024 | $931 | $137,900 | $0 | $0 |
| 2023 | $1,635 | $121,600 | $0 | $0 |
| 2022 | $1,766 | $105,900 | $0 | $0 |
| 2021 | $1,749 | $94,600 | $0 | $0 |
| 2020 | $1,907 | $87,200 | $0 | $0 |
| 2019 | $1,899 | $84,900 | $0 | $0 |
| 2018 | -- | $83,700 | $83,700 | $0 |
| 2017 | -- | $82,500 | $0 | $0 |
| 2016 | -- | $82,300 | $0 | $0 |
| 2013 | -- | $67,100 | $0 | $0 |
Source: Public Records
Map
Nearby Homes
- Lot# 1937 Bob White Way
- L1596&1597 Pheasant Run
- V/L 1634 Partridge Place
- 1439 Apple Hill Cir
- 1791 Oriole Cir
- 1345 Downhill Run
- Lot 1827 Sandpiper Trail
- Lot 1829 Sandpiper Trail
- LOTS 1797 and 1798 Sandpiper Trail
- 1299 Downhill Run
- 1868 Mockingbird Ln
- 1332 Cherry Log Ct
- 6672 St Andrews Dr
- LOTS 1818 and 1819 Falcon Way
- Lots 156 & 157 Humming Bird Ct Unit 156 & 157
- Lots 156 & 157 Humming Bird Ct Unit 156/57
- 6671 Woodcock Ct
- Lot 18 Woodthrush Cir
- 6451 Foothills Trail
- Lot 30 Opal Lake Rd
- 7285 Bob White Way
- 7197 Bob White Way
- 7244 Bob White Way
- 7216 Bob White Way
- 7274 Bob White Way
- 7260 Snow Goose
- 7168 Bob White Way Unit LOTS 1741 & 1742
- 7262 Bob White Way
- 7206 Bob White Way
- 7177 Bob White Way
- 7239 Bob White Way
- 7427 Bob White Way
- 17453 Bob White Way
- 7510 Bob White Way
- 7278 Snow Goose Cir
- 7298 Bob White Way
- 0 Bob White Way Unit 218075100
- 0 Bob White Way Unit 5457300
- 0 Bob White Way Unit 5557908
- 0 Bob White Way Unit 216062676