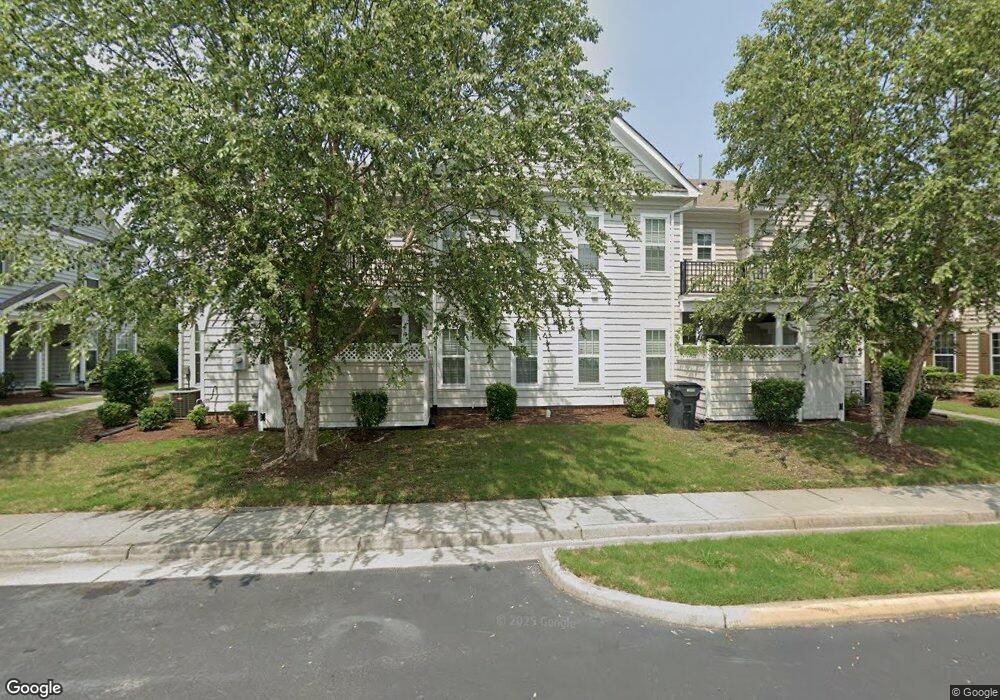
7243 Arrington St Unit C Suffolk, VA 23435
Nansemond NeighborhoodEstimated Value: $278,343 - $289,000
3
Beds
3
Baths
1,415
Sq Ft
$201/Sq Ft
Est. Value
About This Home
This home is located at 7243 Arrington St Unit C, Suffolk, VA 23435 and is currently estimated at $283,836, approximately $200 per square foot. 7243 Arrington St Unit C is a home located in Suffolk City with nearby schools including Creekside Elementary School, John Yeates Middle School, and Nansemond River High School.
Ownership History
Date
Name
Owned For
Owner Type
Purchase Details
Closed on
Aug 11, 2021
Sold by
Lamb Kendall
Bought by
Obeng Sampson Boateng
Current Estimated Value
Home Financials for this Owner
Home Financials are based on the most recent Mortgage that was taken out on this home.
Original Mortgage
$238,256
Outstanding Balance
$216,322
Interest Rate
2.8%
Mortgage Type
New Conventional
Estimated Equity
$67,514
Purchase Details
Closed on
Feb 3, 2020
Sold by
Buck Ella D
Bought by
Lamb Kendall
Home Financials for this Owner
Home Financials are based on the most recent Mortgage that was taken out on this home.
Original Mortgage
$219,945
Interest Rate
3.74%
Mortgage Type
VA
Purchase Details
Closed on
May 17, 2012
Sold by
Terry and Thirty Peterson Resid
Bought by
Buck Wallace R
Home Financials for this Owner
Home Financials are based on the most recent Mortgage that was taken out on this home.
Original Mortgage
$186,494
Interest Rate
4.01%
Mortgage Type
VA
Create a Home Valuation Report for This Property
The Home Valuation Report is an in-depth analysis detailing your home's value as well as a comparison with similar homes in the area
Home Values in the Area
Average Home Value in this Area
Purchase History
| Date | Buyer | Sale Price | Title Company |
|---|---|---|---|
| Obeng Sampson Boateng | $232,900 | Priority Title & Escrow | |
| Lamb Kendall | $215,000 | Va Home Title & Stlmnts Llc | |
| Buck Wallace R | $186,494 | -- |
Source: Public Records
Mortgage History
| Date | Status | Borrower | Loan Amount |
|---|---|---|---|
| Open | Obeng Sampson Boateng | $238,256 | |
| Previous Owner | Lamb Kendall | $219,945 | |
| Previous Owner | Buck Wallace R | $186,494 |
Source: Public Records
Tax History Compared to Growth
Tax History
| Year | Tax Paid | Tax Assessment Tax Assessment Total Assessment is a certain percentage of the fair market value that is determined by local assessors to be the total taxable value of land and additions on the property. | Land | Improvement |
|---|---|---|---|---|
| 2024 | $3,365 | $240,600 | $55,000 | $185,600 |
| 2023 | $90 | $237,200 | $55,000 | $182,200 |
| 2022 | $2,842 | $213,700 | $50,000 | $163,700 |
| 2021 | $2,576 | $190,800 | $40,000 | $150,800 |
| 2020 | $2,479 | $183,600 | $40,000 | $143,600 |
| 2019 | $2,361 | $174,900 | $40,000 | $134,900 |
| 2018 | $36 | $180,000 | $40,000 | $140,000 |
| 2017 | $2,358 | $180,000 | $40,000 | $140,000 |
| 2016 | $2,358 | $180,000 | $40,000 | $140,000 |
| 2015 | -- | $180,000 | $40,000 | $140,000 |
| 2014 | -- | $180,000 | $40,000 | $140,000 |
Source: Public Records
Map
Nearby Homes
- 7234 Arrington St
- 8110 Lee Hall Ave
- 5226 Moreland St
- 7120 Arrington St Unit 131
- 4007 Magnolia Dr
- 3706 Bamboo Rd
- 3705 Bamboo Rd
- 3715 Magnolia Dr
- 206 Rockwood Place
- 3836 Old Farm Rd
- 3601 Forest Haven Ln
- 3817 Harvest Ct
- 6215 Cambridge Dr
- 6755 Burbage Lake Cir
- 3877 Peachtree Ln W
- 3818 Peach Orchard Cir
- 6410 Pelican Crescent N
- 6417 Pelican Crescent N
- 2002 Ashworth Way
- 6341 Old Townpoint Rd
- 7243 Arrington St Unit 430
- 7243 Arrington St Unit 429
- 7243 Arrington St Unit D
- 7243 Arrington St
- 7243 Arrington St Unit 431
- 7239 Arrington St
- 7239 Arrington St Unit D
- 7239 Arrington St Unit 427
- 7239 Arrington St Unit C
- 7239 Arrington St
- 7239 Arrington St Unit B
- 6737 C Hampton Roads Pkwy
- 7249 Arrington St Unit 433
- 7249 Arrington St Unit 436
- 7249 Arrington St Unit 435
- 7249 Arrington St Unit 434
- 7249 Arrington St Unit C
- 7249 Arrington St
- 7249 Arrington St
- 6737 Hampton Roads Pkwy Unit 61