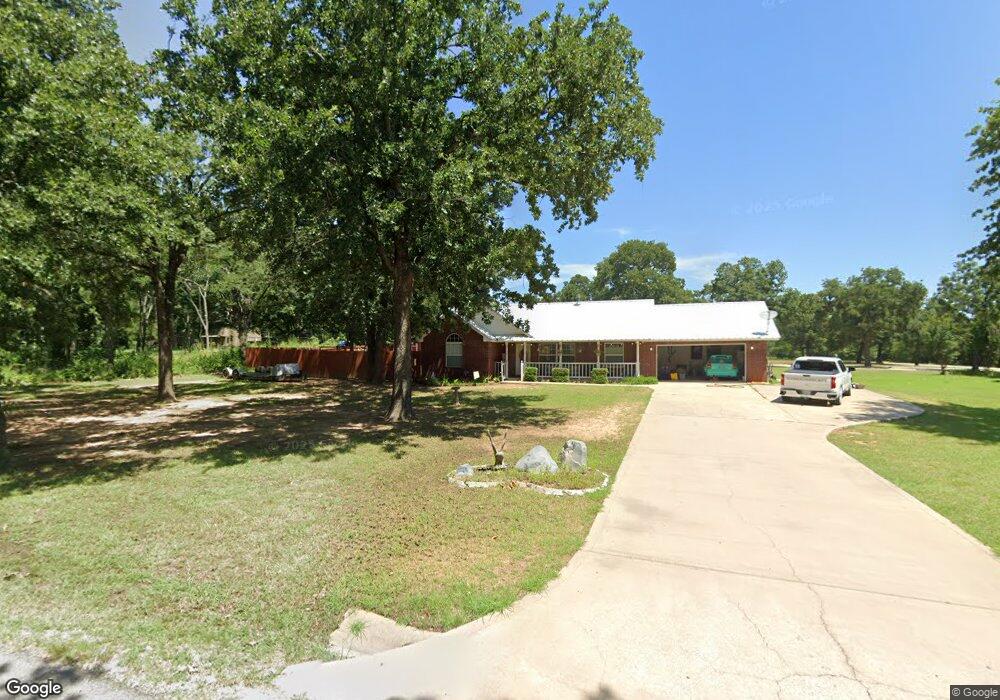
7243 Brock Rd Ardmore, OK 73401
Estimated Value: $267,000 - $340,000
3
Beds
2
Baths
2,119
Sq Ft
$147/Sq Ft
Est. Value
About This Home
This home is located at 7243 Brock Rd, Ardmore, OK 73401 and is currently estimated at $311,047, approximately $146 per square foot. 7243 Brock Rd is a home located in Carter County with nearby schools including Lone Grove Primary School, Lone Grove Intermediate School, and Lone Grove Middle School.
Ownership History
Date
Name
Owned For
Owner Type
Purchase Details
Closed on
Jan 3, 2011
Sold by
Sirva Relocation Credit Llc
Bought by
Chatham Benjamin M and Chatham San Juana
Current Estimated Value
Home Financials for this Owner
Home Financials are based on the most recent Mortgage that was taken out on this home.
Original Mortgage
$196,200
Outstanding Balance
$130,848
Interest Rate
4.56%
Mortgage Type
New Conventional
Estimated Equity
$180,199
Purchase Details
Closed on
Dec 21, 2010
Sold by
Dobbs David Mccann and Dobbs Nicole Rachelle
Bought by
Sirva Relocation Credit Llc
Home Financials for this Owner
Home Financials are based on the most recent Mortgage that was taken out on this home.
Original Mortgage
$196,200
Outstanding Balance
$130,848
Interest Rate
4.56%
Mortgage Type
New Conventional
Estimated Equity
$180,199
Purchase Details
Closed on
Jun 7, 2004
Sold by
Nance Elizabeth
Bought by
Nunnelee Bob
Create a Home Valuation Report for This Property
The Home Valuation Report is an in-depth analysis detailing your home's value as well as a comparison with similar homes in the area
Home Values in the Area
Average Home Value in this Area
Purchase History
| Date | Buyer | Sale Price | Title Company |
|---|---|---|---|
| Chatham Benjamin M | $218,000 | -- | |
| Sirva Relocation Credit Llc | $218,000 | -- | |
| Nunnelee Bob | $8,500 | -- |
Source: Public Records
Mortgage History
| Date | Status | Borrower | Loan Amount |
|---|---|---|---|
| Open | Chatham Benjamin M | $196,200 |
Source: Public Records
Tax History
| Year | Tax Paid | Tax Assessment Tax Assessment Total Assessment is a certain percentage of the fair market value that is determined by local assessors to be the total taxable value of land and additions on the property. | Land | Improvement |
|---|---|---|---|---|
| 2025 | $3,280 | $31,382 | $3,780 | $27,602 |
| 2024 | $3,280 | $29,103 | $3,600 | $25,503 |
| 2023 | $3,044 | $27,717 | $3,600 | $24,117 |
| 2022 | $2,732 | $26,398 | $3,600 | $22,798 |
| 2021 | $2,617 | $25,141 | $4,200 | $20,941 |
| 2020 | $2,602 | $25,141 | $4,200 | $20,941 |
| 2019 | $2,561 | $24,772 | $3,563 | $21,209 |
| 2018 | $2,463 | $23,591 | $1,914 | $21,677 |
| 2017 | $2,578 | $24,798 | $1,914 | $22,884 |
| 2016 | $2,449 | $23,617 | $1,914 | $21,703 |
| 2015 | $2,588 | $22,492 | $1,914 | $20,578 |
| 2014 | $2,635 | $23,829 | $1,914 | $21,915 |
Source: Public Records
Map
Nearby Homes
- 40 Whipperwill St
- 7023 Myall Rd SW
- 270 Hickory St
- 0 High Chaparal Dr Unit 2525272
- 7657 S Brock Rd
- 7657 Brock Rd
- 0 Durango St
- 133 Sierra St
- 90 Barbara Rd
- 8 Van Horn
- 0 Kelly Ln
- 00 Bob White Rd
- 319 Cross Creek Cir
- 145 Cross Creek Cir
- 84 Glenway St
- 0 Foxden Rd Unit 2511367
- 298 Evergreen St
- 58 Wisteria St
- 86 Wisteria St
- 656 Evergreen St
- 7243 Brock Rd Unit Ardmore, OK
- 26 Durango St
- 72 Durango St
- 23 Orchard St
- 43 Timber Ln
- 37 Timber Ln
- 103 Sycamore St
- 219 Timber Ln
- 0000 Timber Ln
- 24 Sycamore St
- 115 Durango St
- 132 Durango St
- 84 Sycamore St
- 133 Sycamore St
- 7162 Brock Rd
- 164 Durango St
- 112 Sycamore St
- 159 Sycamore St
- 138 Sycamore St
- 157 Durango St
Your Personal Tour Guide
Ask me questions while you tour the home.