
Seller's Agent in 2016
Dale Kessler
REOcomplete R.E., Inc.
(484) 707-3201
1 in this area
260 Total Sales
Estimated Value: $150,000 - $213,782
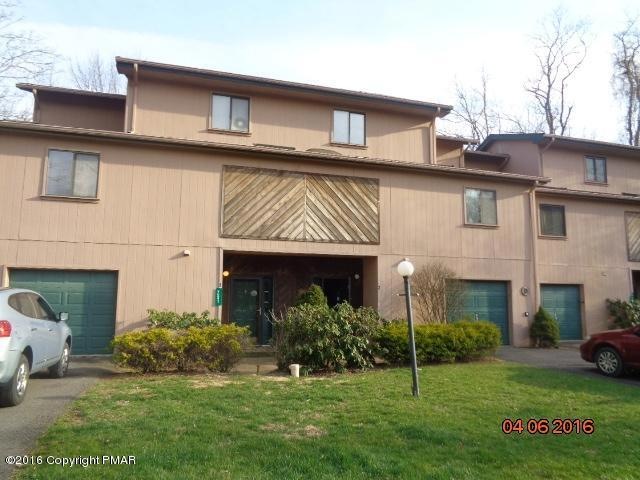
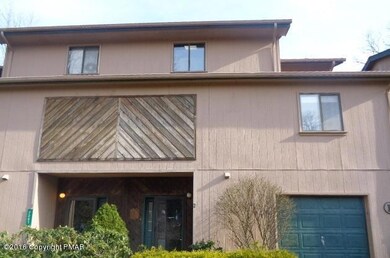
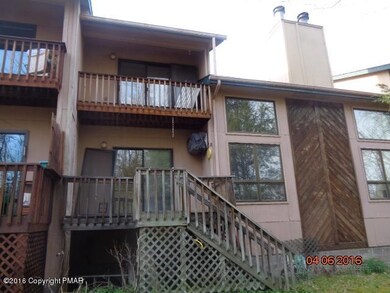
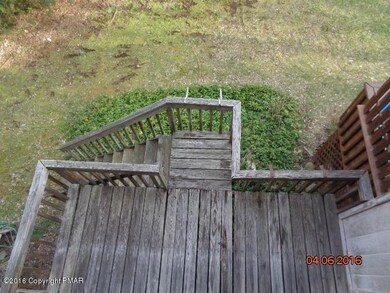
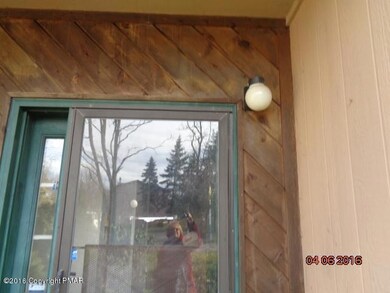
PRICE REDUCTION!!! Come and check out this Onawa Hills Condominium! 2 nice sized bedrooms, 2 full baths, living room with fp, dining area, loft and 2 full baths. 1st level entrance with large family room or additional bedroom. You decide how to utilize all the space! Property is searching for a new owner that will turn me into the GEM of the area. Bring your decorating skills and finesse when you visit and start planning. Priced to sell...call soon and schedule your viewing appointment.
Last Agent to Sell the Property
REOcomplete R.E., Inc. License #RS284385 Listed on: 04/07/2016
Last Buyer's Agent
Dagmara Debowska
Smart Way America Realty
| Date | Buyer | Sale Price | Title Company |
|---|---|---|---|
| Zhang Lei | $90,000 | None Available | |
| Szwaja Agnieszka | $30,000 | Attorney | |
| U S Bank National Association | -- | Attorney | |
| Nationstar Mortgage Llc | -- | Change Of Title Inc |
| Date | Status | Borrower | Loan Amount |
|---|---|---|---|
| Open | Zhang Lei | $48,750 |
| Date | Event | Price | List to Sale | Price per Sq Ft |
|---|---|---|---|---|
| 07/07/2016 07/07/16 | Sold | $30,000 | -24.8% | $23 / Sq Ft |
| 05/09/2016 05/09/16 | Pending | -- | -- | -- |
| 04/04/2016 04/04/16 | For Sale | $39,900 | -- | $31 / Sq Ft |
| Year | Tax Paid | Tax Assessment Tax Assessment Total Assessment is a certain percentage of the fair market value that is determined by local assessors to be the total taxable value of land and additions on the property. | Land | Improvement |
|---|---|---|---|---|
| 2025 | $651 | $82,260 | $9,000 | $73,260 |
| 2024 | $541 | $82,260 | $9,000 | $73,260 |
| 2023 | $2,153 | $82,260 | $9,000 | $73,260 |
| 2022 | $2,116 | $82,260 | $9,000 | $73,260 |
| 2021 | $2,116 | $82,260 | $9,000 | $73,260 |
| 2020 | $2,116 | $82,260 | $9,000 | $73,260 |
| 2019 | $4,158 | $23,520 | $3,500 | $20,020 |
| 2018 | $4,158 | $23,520 | $3,500 | $20,020 |
| 2017 | $4,205 | $23,520 | $3,500 | $20,020 |
| 2016 | $976 | $23,520 | $3,500 | $20,020 |
| 2015 | -- | $23,520 | $3,500 | $20,020 |
| 2014 | -- | $23,520 | $3,500 | $20,020 |
Seller's Agent in 2016
Dale Kessler
REOcomplete R.E., Inc.
(484) 707-3201
1 in this area
260 Total Sales
D
Buyer's Agent in 2016
Dagmara Debowska
Smart Way America Realty
Source: Pocono Mountains Association of REALTORS®
MLS Number: PM-33948
APN: 01.11.1.30-14
Disclaimer: Certain information contained herein is derived from information provided by parties other than Homes.com. All information provided is deemed reliable, but is not guaranteed to be accurate and should be independently verified.
![]() The data relating to real estate for sale on this web site includes listings held by MLS-IDX Participants of the Internet Data Exchange program of the Multiple Listing Service of the Pocono Mountains Association of Realtors®. Listings marked with the Internet Data Exchange logo are not necessarilty the listings of the owner of this web site. All listing data is the copyrighted property of the aforesaid Associations and its MLS-IDX Participants with all rights reserved. The information contained herein is believed to be accurate, but no warranty as such is expressed or implied.
The data relating to real estate for sale on this web site includes listings held by MLS-IDX Participants of the Internet Data Exchange program of the Multiple Listing Service of the Pocono Mountains Association of Realtors®. Listings marked with the Internet Data Exchange logo are not necessarilty the listings of the owner of this web site. All listing data is the copyrighted property of the aforesaid Associations and its MLS-IDX Participants with all rights reserved. The information contained herein is believed to be accurate, but no warranty as such is expressed or implied.