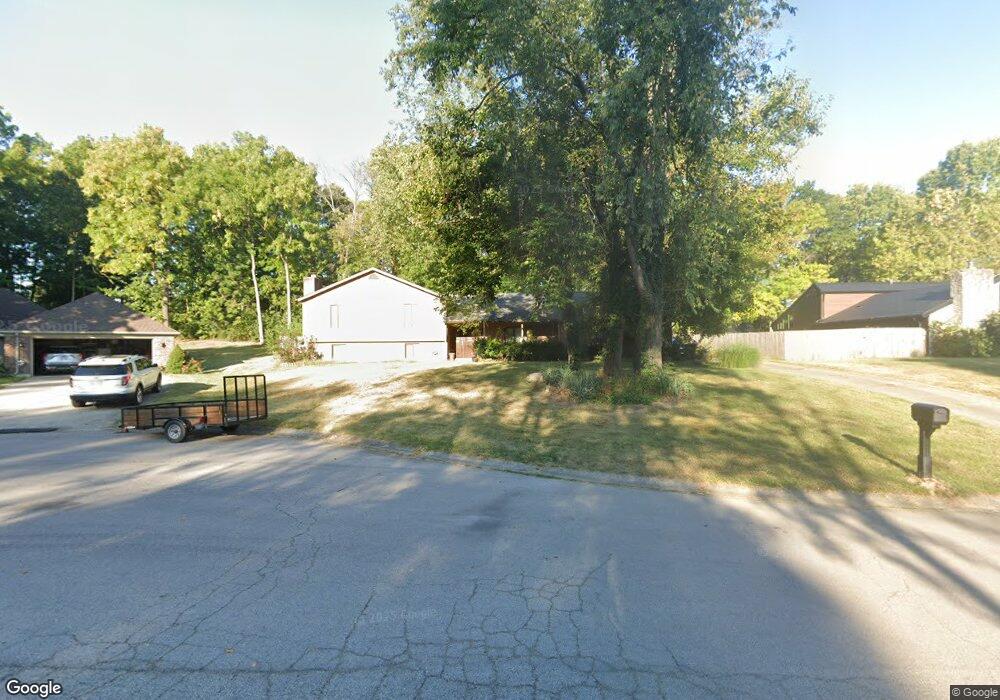
7243 Pepperton Ct Clayton, OH 45322
Estimated Value: $310,678 - $346,000
4
Beds
3
Baths
2,878
Sq Ft
$114/Sq Ft
Est. Value
About This Home
This home is located at 7243 Pepperton Ct, Clayton, OH 45322 and is currently estimated at $328,920, approximately $114 per square foot. 7243 Pepperton Ct is a home located in Montgomery County with nearby schools including Northmoor Elementary School, Northmont High School, and Imagine Schools - Woodbury Academy.
Ownership History
Date
Name
Owned For
Owner Type
Purchase Details
Closed on
Mar 27, 2009
Sold by
Wissing James E and Wissing Karen R
Bought by
Chambers James M and Chambers Emily A
Current Estimated Value
Home Financials for this Owner
Home Financials are based on the most recent Mortgage that was taken out on this home.
Original Mortgage
$138,225
Outstanding Balance
$88,175
Interest Rate
5.11%
Mortgage Type
Purchase Money Mortgage
Estimated Equity
$240,745
Purchase Details
Closed on
Sep 27, 2002
Sold by
Duran Moises S Jr Tr And Araceli C Tr
Bought by
Wissing James E and Wissing Karin R
Home Financials for this Owner
Home Financials are based on the most recent Mortgage that was taken out on this home.
Original Mortgage
$143,418
Interest Rate
6.39%
Mortgage Type
Purchase Money Mortgage
Purchase Details
Closed on
Sep 25, 2000
Sold by
Sicnolf James A
Bought by
Duran Moises S and Duran Araceli C
Purchase Details
Closed on
Aug 18, 2000
Sold by
Sicnolf James A
Bought by
Duran Moises S and Duran Araceli C
Create a Home Valuation Report for This Property
The Home Valuation Report is an in-depth analysis detailing your home's value as well as a comparison with similar homes in the area
Home Values in the Area
Average Home Value in this Area
Purchase History
| Date | Buyer | Sale Price | Title Company |
|---|---|---|---|
| Chambers James M | $145,500 | Attorney | |
| Wissing James E | $179,900 | -- | |
| Duran Moises S | $140,750 | -- | |
| Duran Moises S | $140,750 | -- |
Source: Public Records
Mortgage History
| Date | Status | Borrower | Loan Amount |
|---|---|---|---|
| Open | Chambers James M | $138,225 | |
| Previous Owner | Wissing James E | $143,418 |
Source: Public Records
Tax History Compared to Growth
Tax History
| Year | Tax Paid | Tax Assessment Tax Assessment Total Assessment is a certain percentage of the fair market value that is determined by local assessors to be the total taxable value of land and additions on the property. | Land | Improvement |
|---|---|---|---|---|
| 2024 | $4,913 | $85,130 | $14,700 | $70,430 |
| 2023 | $4,913 | $85,130 | $14,700 | $70,430 |
| 2022 | $4,610 | $60,810 | $10,500 | $50,310 |
| 2021 | $4,623 | $60,810 | $10,500 | $50,310 |
| 2020 | $4,620 | $60,810 | $10,500 | $50,310 |
| 2019 | $4,343 | $51,450 | $10,500 | $40,950 |
| 2018 | $4,354 | $51,450 | $10,500 | $40,950 |
| 2017 | $4,297 | $51,450 | $10,500 | $40,950 |
| 2016 | $4,211 | $49,350 | $10,500 | $38,850 |
| 2015 | $3,869 | $49,350 | $10,500 | $38,850 |
| 2014 | $3,869 | $49,350 | $10,500 | $38,850 |
| 2012 | -- | $63,750 | $12,250 | $51,500 |
Source: Public Records
Map
Nearby Homes
- 7116 Dominican Dr
- 5420 Savina Ave
- 7171 Dominican Dr
- 164 Copperfield Dr
- 173 Copperfield Dr
- 7196 Dominican Dr
- 5282 Rahway Ct
- 6885 Garber Rd
- 108 Copperfield Dr
- 7201 Mckenna Place
- 3324 Northfield Rd
- 117 Candle Ct Unit 740
- 178 Candle Ct Unit 14
- 174 Candle Ct Unit 12
- 4311 Reeves Ct
- 3631 Greenbay Dr
- 410 Amy Ct
- 4310 Corydale Ct
- 14 Dorchester Dr
- 23 Glenhaven Rd
- 7243 Pepperton Ct
- 7249 Pepperton Ct
- 7239 Pepperton Ct
- 7110 Lempco Ln
- 7255 Pepperton Ct
- 7238 Pepperton Ct
- 7250 Pepperton Ct
- 7244 Pepperton Ct
- 7062 Dominican Dr
- 7256 Pepperton Ct
- 7072 Dominican Dr
- 346 Shadywood Dr
- 350 Shadywood Dr
- 7052 Dominican Dr
- 340 Shadywood Dr
- 7111 Lempco Ln
- 354 Shadywood Dr
- 7239 Fontella Ct
- 7233 Fontella Ct
- 7245 Fontella Ct