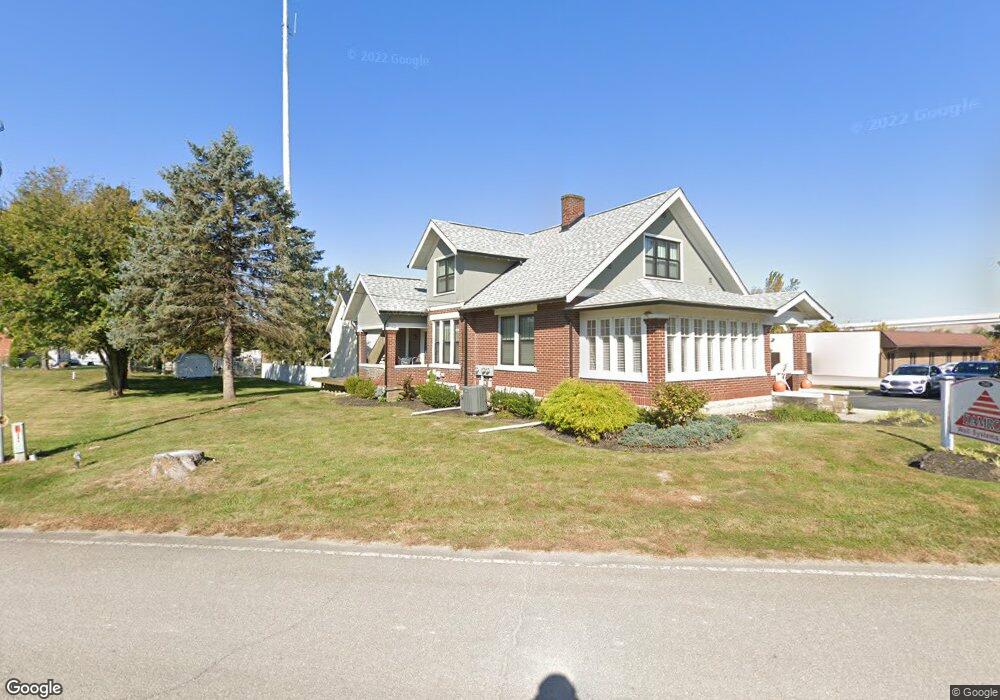
7245 Babbert Place Canal Winchester, OH 43110
Estimated Value: $363,473
3
Beds
2
Baths
2,017
Sq Ft
$180/Sq Ft
Est. Value
About This Home
This home is located at 7245 Babbert Place, Canal Winchester, OH 43110 and is currently estimated at $363,473, approximately $180 per square foot. 7245 Babbert Place is a home located in Fairfield County with nearby schools including Winchester Trail Elementary School, Indian Trail Elementary School, and Canal Winchester Middle School.
Ownership History
Date
Name
Owned For
Owner Type
Purchase Details
Closed on
Aug 9, 2005
Sold by
Maguire Charles and Maguire Randi
Bought by
Damron Michael J and Damron Penny E
Current Estimated Value
Home Financials for this Owner
Home Financials are based on the most recent Mortgage that was taken out on this home.
Original Mortgage
$124,800
Outstanding Balance
$65,685
Interest Rate
5.69%
Mortgage Type
Commercial
Estimated Equity
$297,788
Purchase Details
Closed on
Sep 25, 1995
Sold by
Swartzlander James R
Bought by
Cunningham Robert L
Home Financials for this Owner
Home Financials are based on the most recent Mortgage that was taken out on this home.
Original Mortgage
$65,000
Interest Rate
7.78%
Mortgage Type
Commercial
Purchase Details
Closed on
Jul 15, 1991
Sold by
Deible Clarence J
Bought by
Swartzlander James R
Create a Home Valuation Report for This Property
The Home Valuation Report is an in-depth analysis detailing your home's value as well as a comparison with similar homes in the area
Home Values in the Area
Average Home Value in this Area
Purchase History
| Date | Buyer | Sale Price | Title Company |
|---|---|---|---|
| Damron Michael J | $156,000 | -- | |
| Cunningham Robert L | $81,250 | -- | |
| Swartzlander James R | $81,000 | -- |
Source: Public Records
Mortgage History
| Date | Status | Borrower | Loan Amount |
|---|---|---|---|
| Open | Damron Michael J | $124,800 | |
| Closed | Cunningham Robert L | $65,000 |
Source: Public Records
Tax History Compared to Growth
Tax History
| Year | Tax Paid | Tax Assessment Tax Assessment Total Assessment is a certain percentage of the fair market value that is determined by local assessors to be the total taxable value of land and additions on the property. | Land | Improvement |
|---|---|---|---|---|
| 2024 | $4,838 | $45,280 | $13,970 | $31,310 |
| 2023 | $3,106 | $45,280 | $13,970 | $31,310 |
| 2022 | $3,320 | $45,280 | $13,970 | $31,310 |
| 2021 | $3,378 | $45,280 | $13,970 | $31,310 |
| 2020 | $5,268 | $45,280 | $13,970 | $31,310 |
| 2019 | $7,131 | $86,440 | $55,130 | $31,310 |
| 2018 | $3,053 | $38,930 | $13,970 | $24,960 |
| 2017 | $3,054 | $38,930 | $13,970 | $24,960 |
| 2016 | $3,133 | $38,930 | $13,970 | $24,960 |
| 2015 | $2,987 | $37,810 | $13,970 | $23,840 |
| 2014 | $2,908 | $37,810 | $13,970 | $23,840 |
| 2013 | $2,908 | $37,810 | $13,970 | $23,840 |
Source: Public Records
Map
Nearby Homes
- 0 Diley Rd NW
- 0 Shade Dr
- 9845 Basil Western Rd NW
- 9700 Waterloo Eastern Rd
- 6900 Waterloo Rd NW
- 237 Chaney Mill Way
- 6772 Ohio Canal Ct NW
- 6545 Waterloo Rd NW
- 8537 Greengate Blvd
- 8115 Hill Rd
- Marigold with Full Basement Plan at Greengate Cove
- Iris with Full Basement Plan at Greengate Cove
- Lily with Full Basement Plan at Greengate Cove
- 125 Beaty Ct
- Austin Plan at South Hampton
- Abington Plan at South Hampton
- Irving Plan at South Hampton
- Somerset Plan at South Hampton
- Miramar Plan at South Hampton
- Sanibel Plan at South Hampton
- 7245 Hill Rd
- 7115 Waterloo Eastern Ct
- 7205 Hill Rd
- 7074 Waterloo Eastern Ct
- 7165 Hill Rd
- 7252 Shade Rd
- 7060 Waterloo Eastern Ct
- 7210 Shade Dr
- 7417 Hill Rd
- 7170 Diley Rd
- 6974 Waterloo Place Rd
- 9560 Waterloo-Eastern Rd NW
- 0 Waterloo-Eastern Rd NW
- 7025 Waterloo Rd
- 7025 Waterloo Place Rd
- 6989 Hill Rd
- 10060 Waterloo Eastern Rd
- 9845 Basil Western Rd NW
- 6995 Waterloo Rd
- 6975 Waterloo Place Rd