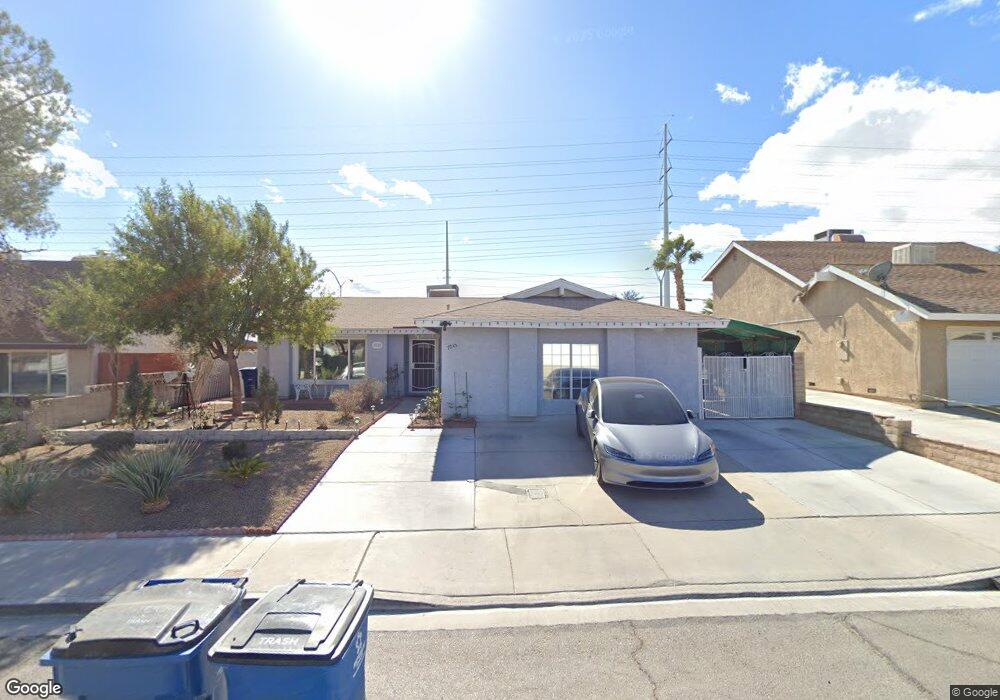
7245 Bridgeview Ave Las Vegas, NV 89147
Estimated Value: $411,896 - $454,000
4
Beds
2
Baths
1,799
Sq Ft
$241/Sq Ft
Est. Value
About This Home
This home is located at 7245 Bridgeview Ave, Las Vegas, NV 89147 and is currently estimated at $433,724, approximately $241 per square foot. 7245 Bridgeview Ave is a home located in Clark County with nearby schools including Pat Diskin Elementary School, Clifford J Lawrence Junior High School, and Spring Valley High School.
Ownership History
Date
Name
Owned For
Owner Type
Purchase Details
Closed on
Sep 27, 2007
Sold by
Ringler Michael O and Ringler Teresa D
Bought by
Ruiz Pascual
Current Estimated Value
Home Financials for this Owner
Home Financials are based on the most recent Mortgage that was taken out on this home.
Original Mortgage
$240,000
Outstanding Balance
$196,690
Interest Rate
6.4%
Mortgage Type
Unknown
Estimated Equity
$237,034
Purchase Details
Closed on
Jun 22, 1999
Sold by
Cole Calvin L and Cole Angie
Bought by
Ringler Michael O and Ringler Teresa D
Home Financials for this Owner
Home Financials are based on the most recent Mortgage that was taken out on this home.
Original Mortgage
$119,990
Interest Rate
7.05%
Mortgage Type
FHA
Create a Home Valuation Report for This Property
The Home Valuation Report is an in-depth analysis detailing your home's value as well as a comparison with similar homes in the area
Home Values in the Area
Average Home Value in this Area
Purchase History
| Date | Buyer | Sale Price | Title Company |
|---|---|---|---|
| Ruiz Pascual | $240,000 | Great American Title | |
| Ringler Michael O | $121,000 | Fidelity National Title Agen |
Source: Public Records
Mortgage History
| Date | Status | Borrower | Loan Amount |
|---|---|---|---|
| Open | Ruiz Pascual | $240,000 | |
| Previous Owner | Ringler Michael O | $119,990 |
Source: Public Records
Tax History Compared to Growth
Tax History
| Year | Tax Paid | Tax Assessment Tax Assessment Total Assessment is a certain percentage of the fair market value that is determined by local assessors to be the total taxable value of land and additions on the property. | Land | Improvement |
|---|---|---|---|---|
| 2025 | $1,238 | $63,756 | $35,350 | $28,406 |
| 2024 | $1,203 | $63,756 | $35,350 | $28,406 |
| 2023 | $1,203 | $63,230 | $35,000 | $28,230 |
| 2022 | $1,168 | $53,695 | $27,300 | $26,395 |
| 2021 | $1,134 | $49,130 | $23,450 | $25,680 |
| 2020 | $1,098 | $49,431 | $23,450 | $25,981 |
| 2019 | $1,066 | $47,116 | $21,000 | $26,116 |
| 2018 | $1,035 | $44,674 | $19,250 | $25,424 |
| 2017 | $1,280 | $43,650 | $17,500 | $26,150 |
| 2016 | $981 | $39,591 | $12,600 | $26,991 |
| 2015 | $978 | $37,553 | $10,500 | $27,053 |
| 2014 | $949 | $31,406 | $8,050 | $23,356 |
Source: Public Records
Map
Nearby Homes
- 7225 Bridgeview Ave
- 7285 Pinebrook Cir
- 7400 W Flamingo Rd Unit 1071
- 7400 W Flamingo Rd Unit 2094
- 7400 W Flamingo Rd Unit 1033
- 7400 W Flamingo Rd Unit 2013
- 3974 Round Wood St
- 7015 Quarry Dr
- 7227 Galley Dr Unit 6A
- 4343 Chessman Way
- 7072 Parasol Ln
- 7570 W Flamingo Rd Unit 219
- 7570 W Flamingo Rd Unit 125
- 6979 Stober Ct
- 4276 Aspen St
- 4121 Satinwood Dr
- 7324 Empress Dr
- 3869 Spruceview Ct
- 4454 Honeycomb Dr Unit 9
- 4419 Fairmont Cir
- 7235 Bridgeview Ave
- 7255 Bridgeview Ave
- 7265 Bridgeview Ave
- 7254 Bridgeview Ave
- 7215 Bridgeview Ave
- 7275 Bridgeview Ave
- 7234 Bridgeview Ave
- 7264 Bridgeview Ave
- 7224 Bridgeview Ave
- 7230 Clearwater Cir
- 7274 Bridgeview Ave
- 7205 Bridgeview Ave
- 7285 Bridgeview Ave
- 7240 Clearwater Cir
- 7253 Archcrest Ave
- 7243 Archcrest Ave
- 4089 Deerfield Ave
- 7250 Clearwater Cir
- 7233 Archcrest Ave
- 4076 Bridgeview Cir