7246 Alto Ln San Angelo, TX 76904
Estimated Value: $368,917 - $435,000
2
Beds
2
Baths
2,045
Sq Ft
$196/Sq Ft
Est. Value
About This Home
This home is located at 7246 Alto Ln, San Angelo, TX 76904 and is currently estimated at $401,479, approximately $196 per square foot. 7246 Alto Ln is a home located in Tom Green County with nearby schools including Lamar Elementary School, Glenn Middle School, and Central High School.
Ownership History
Date
Name
Owned For
Owner Type
Purchase Details
Closed on
Sep 17, 2004
Sold by
Johns Tom and Johns Gloria
Bought by
Allbright James F and Hervi Elaine
Current Estimated Value
Purchase Details
Closed on
Jan 22, 2003
Sold by
Jonas James C and Jonas Lynn O
Bought by
Allbright James F and Hervi Elaine
Purchase Details
Closed on
Oct 19, 2001
Sold by
Green Jay Maya
Bought by
Allbright James F and Hervi Elaine
Purchase Details
Closed on
Jun 6, 1997
Sold by
Carter Richard W
Bought by
Allbright James F and Hervi Elaine
Purchase Details
Closed on
Jul 13, 1989
Sold by
Carter Richard W
Bought by
Allbright James F and Hervi Elaine
Purchase Details
Closed on
Apr 4, 1989
Sold by
Tuley Thomas E and Tuley Suzanne
Bought by
Allbright James F and Hervi Elaine
Purchase Details
Closed on
Sep 17, 1986
Sold by
Akin B P - Trustee
Bought by
Allbright James F and Hervi Elaine
Create a Home Valuation Report for This Property
The Home Valuation Report is an in-depth analysis detailing your home's value as well as a comparison with similar homes in the area
Home Values in the Area
Average Home Value in this Area
Purchase History
| Date | Buyer | Sale Price | Title Company |
|---|---|---|---|
| Allbright James F | -- | -- | |
| Allbright James F | -- | -- | |
| Allbright James F | -- | -- | |
| Allbright James F | -- | -- | |
| Allbright James F | -- | -- | |
| Allbright James F | -- | -- | |
| Allbright James F | -- | -- |
Source: Public Records
Tax History Compared to Growth
Tax History
| Year | Tax Paid | Tax Assessment Tax Assessment Total Assessment is a certain percentage of the fair market value that is determined by local assessors to be the total taxable value of land and additions on the property. | Land | Improvement |
|---|---|---|---|---|
| 2025 | $2,042 | $327,070 | $38,800 | $288,270 |
| 2024 | $1,931 | $318,080 | $33,740 | $284,340 |
| 2023 | $1,830 | $293,580 | $33,740 | $259,840 |
| 2022 | $3,587 | $313,480 | $22,090 | $291,390 |
| 2021 | $3,637 | $220,660 | $0 | $0 |
| 2020 | $3,710 | $220,660 | $12,270 | $208,390 |
| 2019 | $3,873 | $220,660 | $12,270 | $208,390 |
| 2018 | $3,851 | $220,660 | $12,270 | $208,390 |
| 2017 | $3,683 | $212,570 | $12,270 | $200,300 |
| 2016 | $3,683 | $212,590 | $12,270 | $200,320 |
| 2015 | $3,220 | $214,530 | $12,270 | $202,260 |
| 2014 | $3,355 | $210,930 | $12,270 | $198,660 |
| 2013 | $3,221 | $210,930 | $0 | $0 |
Source: Public Records
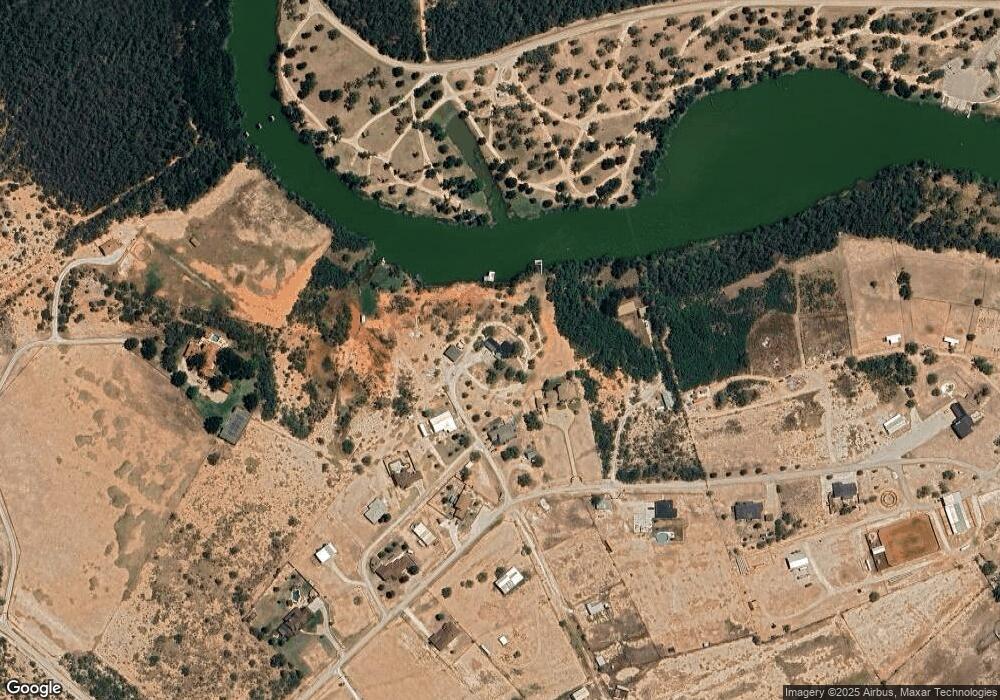
Map
Nearby Homes
- 3101 Red Bluff Rd E Unit 80
- 2706 Red Bluff Ramp Rd
- 2297 Hillside Dr Unit 9
- 2218 Joy Rd
- 2301 Hillside Dr
- TBD Red Bluff Rd
- 2318 Palms Ct Unit 21
- 3901 Margaret Ln
- 2217 Palms Ct Unit 9
- 2225 Palms Ct Unit 10
- 1540 Loop Dr
- 3926 Margaret Ln
- 7413 Easton Ave
- 1632 Canal Rd
- 6001 Vista Del Sol Dr Unit 9
- 2751 Twin Mountain Dr
- 6005 Vista Del Sol Dr Unit 8
- 3937 Blair Ln
- 3945 Blair Ln
- 1969 S Concho Dr
- 7330 Alto Ln
- 6542 Stokes Rd
- 6572 Bonita Loop
- 6450 Stokes Rd
- 6580 Bonita Loop
- . Stokes Rd Unit 3
- ** Stokes Rd
- **** Stokes Rd Unit 1 BEING 1.56 AC
- 6405 Stokes Rd Unit 3
- 6405 Stokes Rd
- 6598 Bonita Loop Unit 5
- 6589 Stokes Rd
- 7464 Spillway Rd
- 6705 Stokes Rd
- 6720 Stokes Rd
- 6660 Stokes Rd
- 6490 Alto Ln Unit 2 and 1
- 6573 Stokes Rd
- 6727 Stokes Rd
- 6601 Stokes Rd