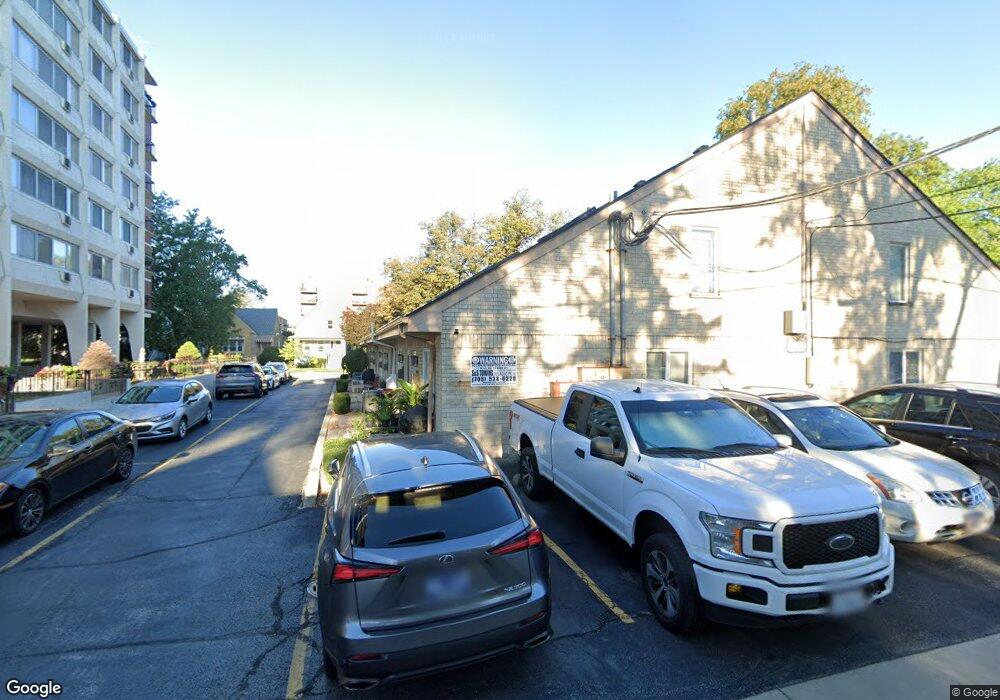
7248 Dixon St Unit 7248A Forest Park, IL 60130
Estimated Value: $163,000 - $202,000
1
Bed
1
Bath
665
Sq Ft
$286/Sq Ft
Est. Value
About This Home
This home is located at 7248 Dixon St Unit 7248A, Forest Park, IL 60130 and is currently estimated at $190,372, approximately $286 per square foot. 7248 Dixon St Unit 7248A is a home located in Cook County with nearby schools including Garfield Elementary School, Field Stevenson Elementary School, and Forest Park Middle School.
Ownership History
Date
Name
Owned For
Owner Type
Purchase Details
Closed on
Jun 15, 2021
Sold by
Pitts Patricia B and Pitts Darrien
Bought by
Overall Bria N
Current Estimated Value
Home Financials for this Owner
Home Financials are based on the most recent Mortgage that was taken out on this home.
Original Mortgage
$144,700
Outstanding Balance
$131,711
Interest Rate
3.25%
Mortgage Type
New Conventional
Estimated Equity
$58,661
Purchase Details
Closed on
May 17, 2017
Sold by
Rataj Carly M
Bought by
Basile Patricia M
Home Financials for this Owner
Home Financials are based on the most recent Mortgage that was taken out on this home.
Original Mortgage
$126,100
Interest Rate
4.5%
Mortgage Type
New Conventional
Purchase Details
Closed on
Aug 24, 2015
Sold by
Maroney Patricia A
Bought by
Rataj Carly M
Purchase Details
Closed on
Dec 27, 2012
Sold by
Maroney Patricia A
Bought by
Maroney Patricia A and Patricia A Maroney Trust
Create a Home Valuation Report for This Property
The Home Valuation Report is an in-depth analysis detailing your home's value as well as a comparison with similar homes in the area
Home Values in the Area
Average Home Value in this Area
Purchase History
| Date | Buyer | Sale Price | Title Company |
|---|---|---|---|
| Overall Bria N | $155,000 | Chicago Title Insurance Co | |
| Basile Patricia M | $130,000 | Chicago Title | |
| Rataj Carly M | $129,000 | Attorney | |
| Maroney Patricia A | -- | None Available |
Source: Public Records
Mortgage History
| Date | Status | Borrower | Loan Amount |
|---|---|---|---|
| Open | Overall Bria N | $144,700 | |
| Previous Owner | Basile Patricia M | $126,100 |
Source: Public Records
Tax History Compared to Growth
Tax History
| Year | Tax Paid | Tax Assessment Tax Assessment Total Assessment is a certain percentage of the fair market value that is determined by local assessors to be the total taxable value of land and additions on the property. | Land | Improvement |
|---|---|---|---|---|
| 2024 | $4,037 | $16,756 | $906 | $15,850 |
| 2023 | $3,413 | $16,756 | $906 | $15,850 |
| 2022 | $3,413 | $12,945 | $816 | $12,129 |
| 2021 | $3,273 | $12,944 | $815 | $12,129 |
| 2020 | $3,265 | $12,944 | $815 | $12,129 |
| 2019 | $2,948 | $11,801 | $747 | $11,054 |
| 2018 | $2,885 | $11,801 | $747 | $11,054 |
| 2017 | $2,842 | $11,801 | $747 | $11,054 |
| 2016 | $3,302 | $11,712 | $679 | $11,033 |
| 2015 | $3,206 | $11,712 | $679 | $11,033 |
| 2014 | $3,164 | $11,712 | $679 | $11,033 |
| 2013 | $2,885 | $11,549 | $679 | $10,870 |
Source: Public Records
Map
Nearby Homes
- 7251 Randolph St Unit C6
- 7240 Franklin St Unit 2A
- 7241 Franklin St Unit B
- 7415 Dixon St
- 246 S Maple Ave Unit 3W
- 300 Circle Ave Unit 4C
- 7421 Washington St
- 315 Marengo Ave Unit 2H
- 344 S Maple Ave Unit 3B
- 317 Wisconsin Ave Unit 1A
- 327 Wisconsin Ave Unit 5B
- 414 Clinton Place Unit 302
- 7449 Washington St Unit 207
- 7243 Madison St Unit 409
- 1042 Washington Blvd Unit 3W
- 435 William St Unit 205
- 435 William St Unit 607
- 426 Wisconsin Ave Unit 3S
- 424 Wisconsin Ave Unit 3N
- 339 Home Ave Unit 3B
- 7248 Dixon St Unit 7248B
- 7250 Dixon St Unit 7250B
- 7250 Dixon St Unit 7250A
- 7250 Dixon St Unit B
- 7248 Dixon St Unit B
- 7250 Dixon St Unit A
- 7248 Dixon St Unit A
- 132 Dixon St Unit 132
- 132 Dixon St
- 7240 Dixon St Unit 7240A
- 7240 Dixon St Unit 7240B
- 134 Marengo Ave
- 134 Marengo Ave Unit 134
- 7246 Dixon St Unit 7246B
- 7246 Dixon St Unit 7246A
- 7246 Dixon St Unit B
- 7244 Dixon St Unit 7244A
- 7244 Dixon St Unit 7244B
- 7244 Dixon St Unit B
- 7242 Dixon St Unit A