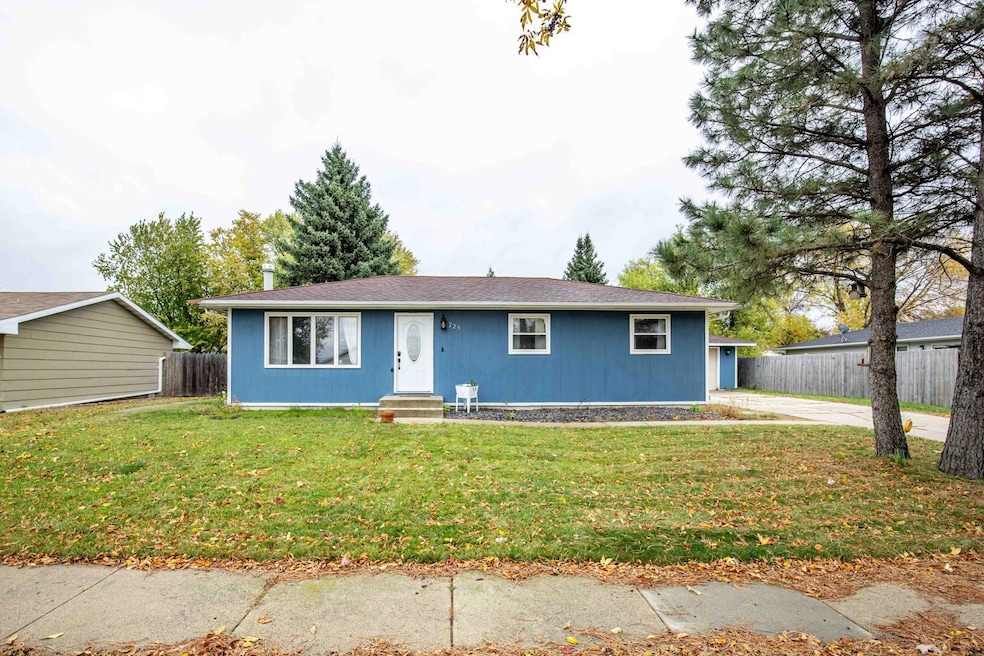
725 31st St N Fargo, ND 58102
Madison-Unicorn NeighborhoodEstimated payment $1,664/month
Highlights
- Bonus Room
- No HOA
- Patio
- North High School Rated A-
- Den
- Living Room
About This Home
Charming rambler in a fantastic location! With NDSU, Madison Elementary, and park nearby, this inviting home features three comfortable bedrooms on the main level. The primary bedroom includes a walk-in closet. Two additional finished rooms downstairs—perfect for a den, home office, gym, hobby space, or sewing room.
The cozy living room offers abundant natural light, while the kitchen includes stainless appliances and brand new flooring installed for the new owners. The lower level also includes a spacious laundry/utility room and an additional bathroom, providing plenty of flexibility for storage and future use.
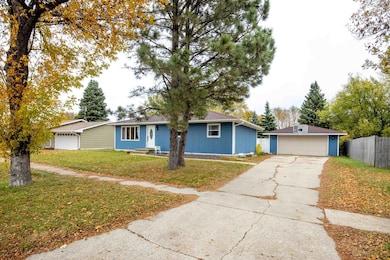
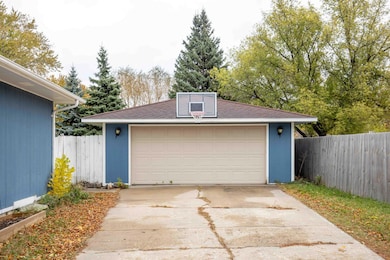
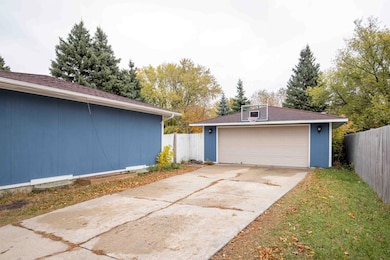
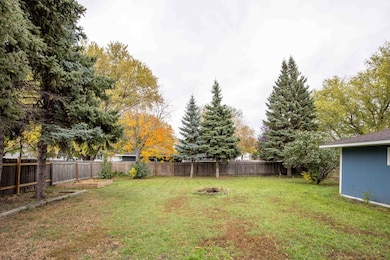
One of the owner’s favorite features is the heated garage —ideal for projects, tinkering, or working through the winter. Outside, you’ll fall in love with the huge, fully fenced backyard, offering ample space for pets, gardens, entertaining, or simply relaxing in privacy.
This home is truly a gem—welcoming, practical, and move-in ready. Don’t miss your chance to make it yours!
Home Details
Home Type
- Single Family
Est. Annual Taxes
- $3,239
Year Built
- Built in 1976
Lot Details
- 10,367 Sq Ft Lot
- Lot Dimensions are 80 x 120 x 80 x 120
- Wood Fence
Parking
- 2 Car Garage
Home Design
- Architectural Shingle Roof
- Wood Siding
Interior Spaces
- 1-Story Property
- Wood Burning Fireplace
- Family Room
- Living Room
- Den
- Bonus Room
- Finished Basement
Kitchen
- Range
- Microwave
- Dishwasher
- Disposal
Bedrooms and Bathrooms
- 3 Bedrooms
Laundry
- Laundry Room
- Dryer
- Washer
Additional Features
- Patio
- Forced Air Heating and Cooling System
Community Details
- No Home Owners Association
- Model Cities Subdivision
Listing and Financial Details
- Assessor Parcel Number 01202000520000
Map
Home Values in the Area
Average Home Value in this Area
Tax History
| Year | Tax Paid | Tax Assessment Tax Assessment Total Assessment is a certain percentage of the fair market value that is determined by local assessors to be the total taxable value of land and additions on the property. | Land | Improvement |
|---|---|---|---|---|
| 2024 | $3,239 | $117,750 | $23,300 | $94,450 |
| 2023 | $3,045 | $111,100 | $23,300 | $87,800 |
| 2022 | $2,954 | $105,800 | $23,300 | $82,500 |
| 2021 | $2,600 | $94,450 | $23,300 | $71,150 |
| 2020 | $2,780 | $98,300 | $27,150 | $71,150 |
| 2019 | $2,414 | $84,300 | $12,600 | $71,700 |
| 2018 | $2,263 | $84,300 | $12,600 | $71,700 |
| 2017 | $2,137 | $80,300 | $12,600 | $67,700 |
| 2016 | $1,923 | $77,950 | $12,600 | $65,350 |
| 2015 | $1,902 | $72,250 | $10,650 | $61,600 |
| 2014 | $1,860 | $68,800 | $10,650 | $58,150 |
| 2013 | $845 | $65,500 | $10,650 | $54,850 |
Property History
| Date | Event | Price | List to Sale | Price per Sq Ft |
|---|---|---|---|---|
| 10/22/2025 10/22/25 | For Sale | $264,900 | -- | $131 / Sq Ft |
Purchase History
| Date | Type | Sale Price | Title Company |
|---|---|---|---|
| Warranty Deed | $210,000 | Regency Title Fargo | |
| Warranty Deed | $189,000 | Fm Title Co | |
| Interfamily Deed Transfer | -- | Title Co |
Mortgage History
| Date | Status | Loan Amount | Loan Type |
|---|---|---|---|
| Open | $206,196 | FHA | |
| Previous Owner | $183,330 | New Conventional | |
| Previous Owner | $120,000 | New Conventional |
Source: NorthstarMLS
MLS Number: 6808259
APN: 01-2020-00520-000
Disclaimer: Certain information contained herein is derived from information provided by parties other than Homes.com. All information provided is deemed reliable, but is not guaranteed to be accurate and should be independently verified.
![]() Based on information submitted to the MLS GRID. All data is obtained from various sources and may not have been verified by broker or MLS GRID. Supplied Open House Information is subject to change without notice. All information should be independently reviewed and verified for accuracy. Properties may or may not be listed by the office/agent presenting the information. Some IDX listings have been excluded from this website.
Based on information submitted to the MLS GRID. All data is obtained from various sources and may not have been verified by broker or MLS GRID. Supplied Open House Information is subject to change without notice. All information should be independently reviewed and verified for accuracy. Properties may or may not be listed by the office/agent presenting the information. Some IDX listings have been excluded from this website.
The Digital Millennium Copyright Act of 1998, 17 U.S.C. § 512 (the “DMCA”) provides recourse for copyright owners who believe that material appearing on the Internet infringes their rights under U.S. copyright law. If you believe in good faith that any content or material made available in connection with our website or services infringes your copyright, you (or your agent) may send us a notice requesting that the content or material be removed, or access to it blocked.
Notices must be sent in writing by email to DMCAnotice@MLSGrid.com.
The DMCA requires that your notice of alleged copyright infringement include the following information:
(1) description of the copyrighted work that is the subject of claimed infringement;
(2) description of the alleged infringing content and information sufficient to permit us to locate the content;
(3) contact information for you, including your address, telephone number and email address;
(4) a statement by you that you have a good faith belief that the content in the manner complained of is not authorized by the copyright owner, or its agent, or by the operation of any law;
(5) a statement by you, signed under penalty of perjury, that the information in the notification is accurate and that you have the authority to enforce the copyrights that are claimed to be infringed; and
(6) a physical or electronic signature of the copyright owner or a person authorized to act on the copyright owner’s behalf. Failure to include all of the above information may result in the delay of the processing of your complaint.
- 1195 35th St N
- 1920 Dakota Dr N
- 1704 Dakota Dr N
- 1109 18th St S
- 1516-1630 Dakota Dr N
- 1120 16th St N
- 1132 16th St N
- 1515 11th Ave N
- 1021-1034 15th N
- 129 16th St S Unit 1
- 618 23rd St S
- 1418 1st Ave N
- 1221 10th Ave N Unit 2
- 1224 11th Ave N
- 1224 11th Ave N
- 720 12th St N
- 1113 University Dr N
- 1222 4th Ave N
- 906 12th St N
- 1118 9th Ave N Unit Down
