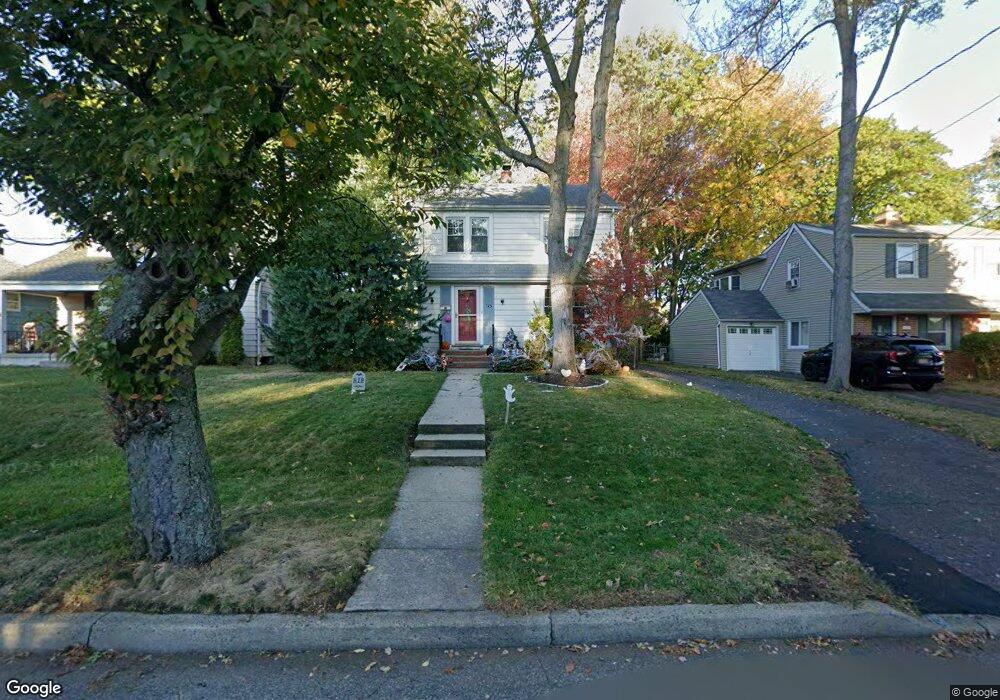
725 5th Ave River Edge, NJ 07661
Estimated Value: $652,000 - $818,822
Studio
--
Bath
1,776
Sq Ft
$419/Sq Ft
Est. Value
About This Home
This home is located at 725 5th Ave, River Edge, NJ 07661 and is currently estimated at $743,956, approximately $418 per square foot. 725 5th Ave is a home located in Bergen County with nearby schools including Roosevelt Elementary School, River Dell Middle School, and River Dell Regional High School.
Ownership History
Date
Name
Owned For
Owner Type
Purchase Details
Closed on
Sep 5, 2012
Sold by
Sabella Kevin and Sabella Sheila
Bought by
Sabella Kevin and Sabella Sheila
Current Estimated Value
Home Financials for this Owner
Home Financials are based on the most recent Mortgage that was taken out on this home.
Original Mortgage
$221,300
Outstanding Balance
$153,275
Interest Rate
3.59%
Mortgage Type
New Conventional
Estimated Equity
$590,681
Purchase Details
Closed on
Apr 14, 2011
Sold by
Lenkel Joanne D
Bought by
Jerlinski Sheila
Home Financials for this Owner
Home Financials are based on the most recent Mortgage that was taken out on this home.
Original Mortgage
$200,000
Interest Rate
4.76%
Mortgage Type
Purchase Money Mortgage
Create a Home Valuation Report for This Property
The Home Valuation Report is an in-depth analysis detailing your home's value as well as a comparison with similar homes in the area
Home Values in the Area
Average Home Value in this Area
Purchase History
We collect this data history from publicly available records. To have your information removed, we recommend requesting removal directly through your county’s website.
| Date | Buyer | Sale Price | Title Company |
|---|---|---|---|
| Sabella Kevin | -- | -- | |
| Jerlinski Sheila | $250,000 | -- |
Source: Public Records
Mortgage History
We collect this data history from publicly available records. To have your information removed, we recommend requesting removal directly through your county’s website.
| Date | Status | Borrower | Loan Amount |
|---|---|---|---|
| Open | Sabella Kevin | $221,300 | |
| Previous Owner | Jerlinski Sheila | $200,000 |
Source: Public Records
Tax History
| Year | Tax Paid | Tax Assessment Tax Assessment Total Assessment is a certain percentage of the fair market value that is determined by local assessors to be the total taxable value of land and additions on the property. | Land | Improvement |
|---|---|---|---|---|
| 2025 | $13,814 | $628,200 | $345,000 | $283,200 |
| 2024 | $13,469 | $348,400 | $172,800 | $175,600 |
| 2023 | $12,891 | $348,400 | $172,800 | $175,600 |
| 2022 | $12,891 | $348,400 | $172,800 | $175,600 |
| 2021 | $12,636 | $348,400 | $172,800 | $175,600 |
| 2020 | $12,438 | $348,400 | $172,800 | $175,600 |
| 2019 | $12,083 | $348,400 | $172,800 | $175,600 |
| 2018 | $11,614 | $342,100 | $172,800 | $169,300 |
| 2017 | $10,943 | $325,500 | $172,800 | $152,700 |
| 2016 | $10,696 | $325,500 | $172,800 | $152,700 |
| 2015 | $10,471 | $325,500 | $172,800 | $152,700 |
| 2014 | $10,491 | $325,500 | $172,800 | $152,700 |
Source: Public Records
Map
Nearby Homes
- 678 Millbrook Rd
- 765 7th Ave
- 255 Jefferson Ave
- 212 Monroe Ave
- 557 Monroe Ct
- 405 Terhune Ave
- 394 Burlington Rd
- 276 Concord Dr
- 317 Edstan Way
- 163 Monroe Ave
- 28 Skye Dr
- 300 Spring Valley Rd
- 410 Burlington Rd
- 7 Tufts Ct
- 395 Hickory Ave
- 431 Cedar Ave
- 172 Concord Dr
- 431 Terhune Ave
- 33 Lincoln Ave
- 3 Elm Place
Your Personal Tour Guide
Ask me questions while you tour the home.