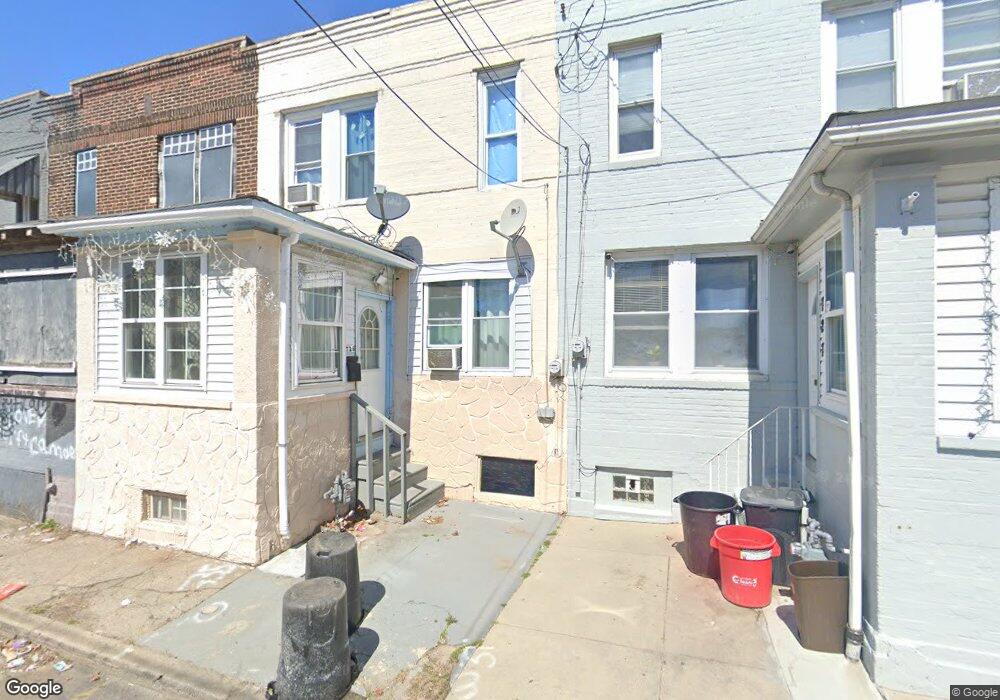
725 Bailey St Camden, NJ 08102
North Camden NeighborhoodEstimated Value: $106,216 - $204,000
Studio
--
Bath
1,152
Sq Ft
$147/Sq Ft
Est. Value
About This Home
This home is located at 725 Bailey St, Camden, NJ 08102 and is currently estimated at $169,804, approximately $147 per square foot. 725 Bailey St is a home located in Camden County with nearby schools including Eastside High School, Leap Academy University Charter School, and Holy Name School.
Ownership History
Date
Name
Owned For
Owner Type
Purchase Details
Closed on
Oct 5, 2016
Sold by
Garcia Clarisa E
Bought by
Ramos Jose D Mateo
Current Estimated Value
Purchase Details
Closed on
Feb 26, 2014
Sold by
Aleman Luis J and Garcia Clarisa
Bought by
Garcia Clarisa E
Purchase Details
Closed on
Mar 5, 2005
Sold by
Lopez Nestora A
Bought by
Aleman Luis J and Garcia Clarisa
Purchase Details
Closed on
Feb 18, 2004
Sold by
Vega Eduardo L
Bought by
Lopez Nestora A
Create a Home Valuation Report for This Property
The Home Valuation Report is an in-depth analysis detailing your home's value as well as a comparison with similar homes in the area
Home Values in the Area
Average Home Value in this Area
Purchase History
| Date | Buyer | Sale Price | Title Company |
|---|---|---|---|
| Ramos Jose D Mateo | -- | None Available | |
| Garcia Clarisa E | -- | None Available | |
| Aleman Luis J | $18,000 | -- | |
| Lopez Nestora A | $18,000 | -- |
Source: Public Records
Tax History
| Year | Tax Paid | Tax Assessment Tax Assessment Total Assessment is a certain percentage of the fair market value that is determined by local assessors to be the total taxable value of land and additions on the property. | Land | Improvement |
|---|---|---|---|---|
| 2025 | $1,704 | $48,100 | $6,400 | $41,700 |
| 2024 | $1,647 | $48,100 | $6,400 | $41,700 |
| 2023 | $1,647 | $48,100 | $6,400 | $41,700 |
| 2022 | $1,617 | $48,100 | $6,400 | $41,700 |
| 2021 | $1,611 | $48,100 | $6,400 | $41,700 |
| 2020 | $1,530 | $48,100 | $6,400 | $41,700 |
| 2019 | $1,465 | $48,100 | $6,400 | $41,700 |
| 2018 | $1,457 | $48,100 | $6,400 | $41,700 |
| 2017 | $1,421 | $48,100 | $6,400 | $41,700 |
| 2016 | $1,376 | $48,100 | $6,400 | $41,700 |
| 2015 | $1,325 | $48,100 | $6,400 | $41,700 |
| 2014 | $1,293 | $48,100 | $6,400 | $41,700 |
Source: Public Records
Map
Nearby Homes
Your Personal Tour Guide
Ask me questions while you tour the home.