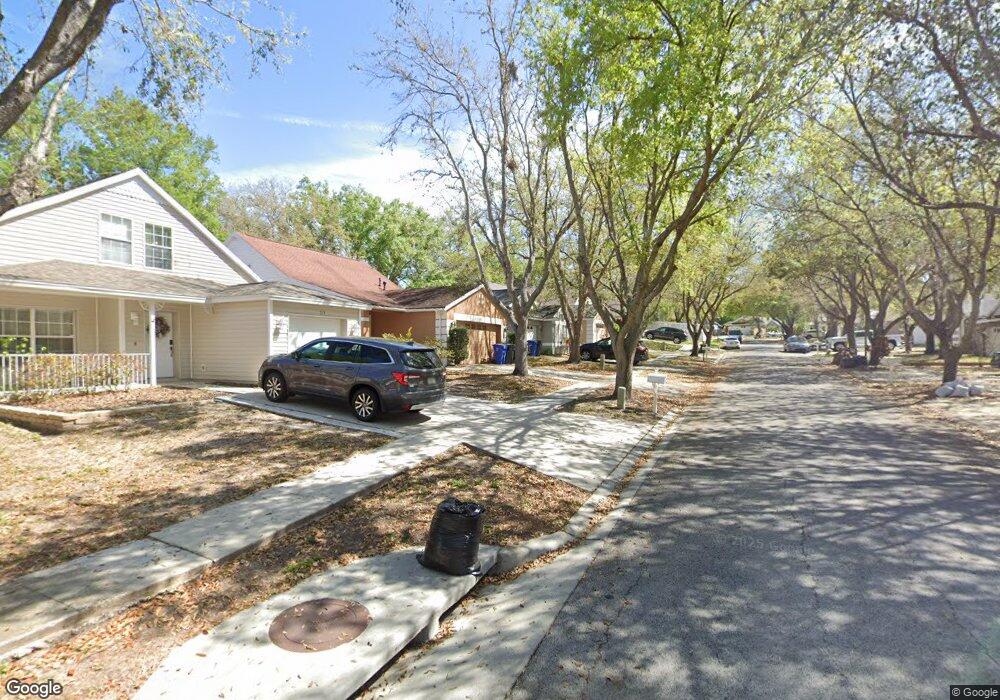
725 Cape Cod Cir Valrico, FL 33594
Estimated Value: $288,000 - $343,000
4
Beds
2
Baths
1,503
Sq Ft
$210/Sq Ft
Est. Value
About This Home
This home is located at 725 Cape Cod Cir, Valrico, FL 33594 and is currently estimated at $315,536, approximately $209 per square foot. 725 Cape Cod Cir is a home located in Hillsborough County with nearby schools including Nelson Elementary School, Mulrennan Middle School, and Durant High School.
Ownership History
Date
Name
Owned For
Owner Type
Purchase Details
Closed on
Aug 1, 2016
Bought by
Progress Residential 2016-1 Bo
Current Estimated Value
Purchase Details
Closed on
Aug 27, 2015
Sold by
Jpmorgan Chase Bank Na
Bought by
Freo Florida Llc
Purchase Details
Closed on
Jun 15, 2011
Sold by
Secretary Of Veterans Affairs
Bought by
Chase Home Finance
Purchase Details
Closed on
Jan 20, 2006
Sold by
Graves Norman B and Graves Gloria L
Bought by
Mclemore Henry L
Home Financials for this Owner
Home Financials are based on the most recent Mortgage that was taken out on this home.
Original Mortgage
$211,765
Interest Rate
6.21%
Mortgage Type
VA
Purchase Details
Closed on
Dec 18, 2000
Sold by
Windward Homes Inc
Bought by
Graves Gloria L and Graves Norman B
Home Financials for this Owner
Home Financials are based on the most recent Mortgage that was taken out on this home.
Original Mortgage
$110,557
Interest Rate
7.79%
Mortgage Type
VA
Purchase Details
Closed on
Sep 1, 2000
Sold by
Kbc Development Inc
Bought by
Windward Homes Inc
Create a Home Valuation Report for This Property
The Home Valuation Report is an in-depth analysis detailing your home's value as well as a comparison with similar homes in the area
Home Values in the Area
Average Home Value in this Area
Purchase History
| Date | Buyer | Sale Price | Title Company |
|---|---|---|---|
| Progress Residential 2016-1 Bo | $100 | -- | |
| Freo Florida Llc | $124,000 | Bay National Title Company | |
| Chase Home Finance | -- | North American Title Company | |
| Mclemore Henry L | $205,000 | Affiliated Title Of Tampa Ba | |
| Graves Gloria L | $108,700 | -- | |
| Windward Homes Inc | $16,900 | -- |
Source: Public Records
Mortgage History
| Date | Status | Borrower | Loan Amount |
|---|---|---|---|
| Previous Owner | Mclemore Henry L | $211,765 | |
| Previous Owner | Windward Homes Inc | $133,350 | |
| Previous Owner | Windward Homes Inc | $110,557 |
Source: Public Records
Tax History
| Year | Tax Paid | Tax Assessment Tax Assessment Total Assessment is a certain percentage of the fair market value that is determined by local assessors to be the total taxable value of land and additions on the property. | Land | Improvement |
|---|---|---|---|---|
| 2025 | $4,490 | $244,090 | $48,400 | $195,690 |
| 2024 | $4,490 | $248,705 | $50,600 | $198,105 |
| 2023 | $4,063 | $216,627 | $44,000 | $172,627 |
| 2022 | $3,764 | $210,917 | $44,000 | $166,917 |
| 2021 | $3,350 | $163,012 | $30,800 | $132,212 |
| 2020 | $3,009 | $141,350 | $29,700 | $111,650 |
| 2019 | $3,203 | $137,707 | $30,800 | $106,907 |
| 2018 | $3,016 | $125,629 | $0 | $0 |
| 2017 | $2,910 | $118,843 | $0 | $0 |
| 2016 | $2,856 | $115,423 | $0 | $0 |
| 2015 | $2,733 | $106,806 | $0 | $0 |
| 2014 | $2,603 | $97,096 | $0 | $0 |
| 2013 | -- | $88,269 | $0 | $0 |
Source: Public Records
Map
Nearby Homes
- 755 Cape Cod Cir
- 807 Cape Cod Cir
- 630 Cape Cod Cir
- 605 Choo Ln Unit 503
- 516 Klickety Klak Ln Unit 544
- 104 Choo Ln
- 3412 Palm Beach Dr
- 837 Rocky Mountain Ct
- 512 Cape Cod Cir
- 3516 Zephyr Ln
- 726 Choo Ln Unit 726F
- 3515 Zephyr Ln
- 3502 Petticoat Jct Unit 447
- 3602 Cinder Dr
- 3510 Petticoat Jct
- 3504 Meteor Place
- 3526 Zephyr Ln Unit 3526ZL
- 3508 Meteor Place Unit 3508MP
- 404 Boxcar Way Unit 557
- 3520 Engineer Dr
- 723 Cape Cod Cir
- 753 Cape Cod Cir
- 719 Cape Cod Cir
- 3407 Long Island Way
- 751 Cape Cod Cir
- 3405 Long Island Way
- 759 Cape Cod Cir
- 3403 Long Island Way
- 724 Cape Cod Cir
- 717 Cape Cod Cir
- 722 Cape Cod Cir
- 726 Cape Cod Cir
- 738 Cape Cod Cir
- 749 Cape Cod Cir
- 761 Cape Cod Cir
- 720 Cape Cod Cir
- 727 Cape Cod Cir
- 728 Cape Cod Cir
- 718 Cape Cod Cir
- 721 Cape Cod Cir
Your Personal Tour Guide
Ask me questions while you tour the home.