725 Cypress Rd Saint Augustine, FL 32086
Rolling Hills NeighborhoodEstimated payment $3,115/month
Highlights
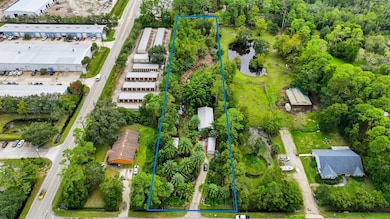
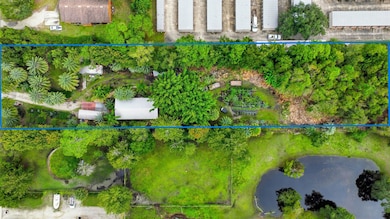
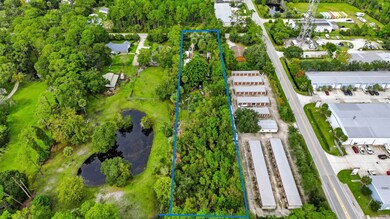
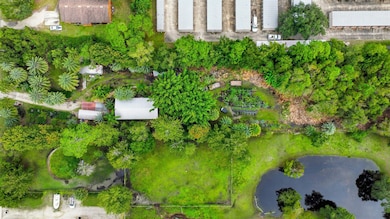
- 1.59 Acre Lot
- Wooded Lot
- Central Heating and Cooling System
- Otis A. Mason Elementary School Rated A
- Tile Flooring
- Dining Room
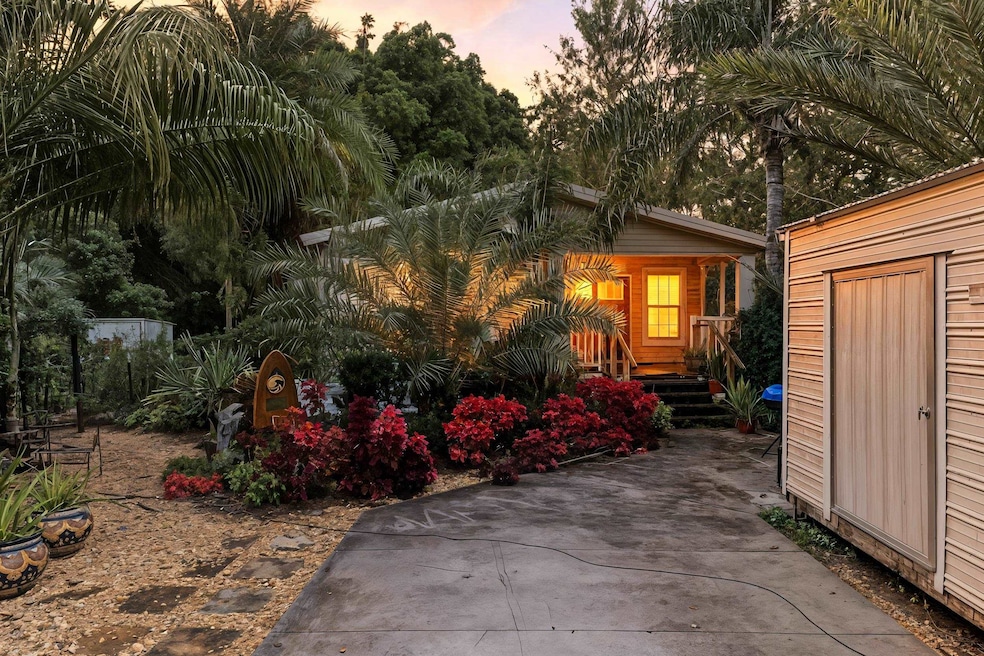
About This Home
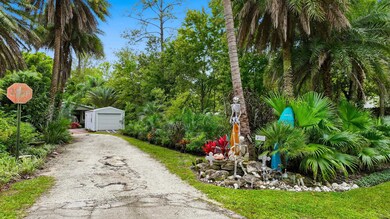
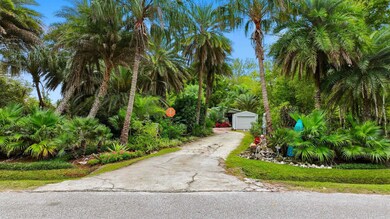
Rare opportunity in St. Augustine Beach! Enjoy over 1.5 acres of partially cleared, lushly landscaped land with no HOA, a true find this close to the coast. Tucked away on a quiet street with only 10 homes, this property offers privacy, space, and endless potential. Property highlights are this 3 Bedrooms, 2 Bathrooms, 1,500+ sq ft home. Two 12x30 ft sheds with electricity — ideal for a workshop, studio, or storage. City water connection. Partially cleared with mature trees and tropical landscaping. Talk about having a prime location just 8 minutes to the beach, 5 minutes to historic downtown St. Augustine and 3 minutes to shopping & dining. Whether you’re looking to expand, build your dream retreat, or enjoy spacious coastal living, this property offers unmatched flexibility and convenience. There is a ton of potential and possibilities for this 1.5 acre parcel.
Property Details
Home Type
- Modular Prefabricated Home
Est. Annual Taxes
- $3,479
Year Built
- Built in 2007
Lot Details
- 1.59 Acre Lot
- Rectangular Lot
- Wooded Lot
Home Design
- Metal Roof
Interior Spaces
- 1,505 Sq Ft Home
- 1-Story Property
- Window Treatments
- Dining Room
Flooring
- Carpet
- Laminate
- Tile
Bedrooms and Bathrooms
- 3 Bedrooms
- 2 Full Bathrooms
- Primary Bathroom includes a Walk-In Shower
Schools
- Otis A. Mason Elementary School
- Gamble Rogers Middle School
- Pedro Menendez High School
Utilities
- Central Heating and Cooling System
Listing and Financial Details
- Assessor Parcel Number 099520-0121
Map
Home Values in the Area
Average Home Value in this Area
Tax History
| Year | Tax Paid | Tax Assessment Tax Assessment Total Assessment is a certain percentage of the fair market value that is determined by local assessors to be the total taxable value of land and additions on the property. | Land | Improvement |
|---|---|---|---|---|
| 2025 | $3,368 | $254,212 | -- | -- |
| 2024 | $3,368 | $290,365 | $124,656 | $165,709 |
| 2023 | $3,368 | $290,361 | $124,656 | $165,705 |
| 2022 | $3,349 | $310,890 | $124,656 | $186,234 |
| 2021 | $2,525 | $173,631 | $0 | $0 |
| 2020 | $2,383 | $161,006 | $0 | $0 |
| 2019 | $2,377 | $153,170 | $0 | $0 |
| 2018 | $2,369 | $151,331 | $0 | $0 |
| 2017 | $2,277 | $142,965 | $34,980 | $107,985 |
| 2016 | $2,125 | $127,538 | $0 | $0 |
| 2015 | $2,183 | $128,545 | $0 | $0 |
| 2014 | $2,107 | $123,987 | $0 | $0 |
Property History
| Date | Event | Price | List to Sale | Price per Sq Ft |
|---|---|---|---|---|
| 12/03/2025 12/03/25 | Price Changed | $549,000 | -6.8% | $365 / Sq Ft |
| 11/04/2025 11/04/25 | For Sale | $589,000 | -- | $391 / Sq Ft |
Purchase History
| Date | Type | Sale Price | Title Company |
|---|---|---|---|
| Warranty Deed | -- | Gullett Title Inc | |
| Warranty Deed | $119,000 | Land Title Of America Group | |
| Warranty Deed | $74,000 | Land Title Of America Group | |
| Warranty Deed | -- | Land Title Of America Group |
Mortgage History
| Date | Status | Loan Amount | Loan Type |
|---|---|---|---|
| Previous Owner | $94,000 | Seller Take Back |
Source: St. Augustine and St. Johns County Board of REALTORS®
MLS Number: 256105
APN: 099520-0121
Disclaimer: Certain information contained herein is derived from information provided by parties other than Homes.com. All information provided is deemed reliable, but is not guaranteed to be accurate and should be independently verified.
![]() IDX information is provided exclusively for personal, non-commercial use, and may not be used for any purpose other than to identify prospective properties consumers may be interested in purchasing.
IDX information is provided exclusively for personal, non-commercial use, and may not be used for any purpose other than to identify prospective properties consumers may be interested in purchasing.
Information is deemed reliable but not guaranteed.
© 2026 St Augustine &
St. Johns County Board of REALTORS®. All rights reserved.
- 724 Cypress Rd
- 736--8 Kings Estate Rd
- 127 Shell Creek Ct
- 86 Shell Creek Ct
- 785 Kings Estate Rd
- 0 Rolling Hills Dr Unit 260130
- 920 Kings Estate Rd
- 00 Kings Estate Rd
- 425 S Hidden Tree Dr
- 121 Moultrie Village Ln
- 110 Moultrie Village Ln
- 0 Dobbs Rd Unit 255110
- 0 Dobbs Rd Unit MFRGC533824
- 0 Dobbs Rd Unit 2107194
- 22 Ridge Lake Rd
- 38 Ridge Lake Rd
- 54 Ridge Lake Rd
- 74 Ridge Lake Rd
- 132 Summerhill Cir
- 420 S Villa San Marco Dr Unit 304
- 809 N Garden Lake Dr
- 129 Moultrie Village Ln
- 309 Summercove Cir
- 54 Ridge Lake Rd
- 295 Green Turtle Ln
- 890 Poinsettia Rd Unit B
- 90 Ridge Lake Rd
- 106 Ridge Lake Rd
- 440 S Villa San Marco Dr Unit 106
- 410 S Villa San Marco Dr Unit 201
- 410 S Villa San Marco Dr Unit 102
- 318 Fox Water Trail
- 63 Palma Dr
- 105 Moultrie Crossing Ln
- 107 Palma Dr
- 113 Palma Dr
- 58 Zaragoza Dr
- 66 Pamplona Dr
- 81 Zaragoza Dr
- 45 Pamplona Dr

Ask me questions while you tour the home.