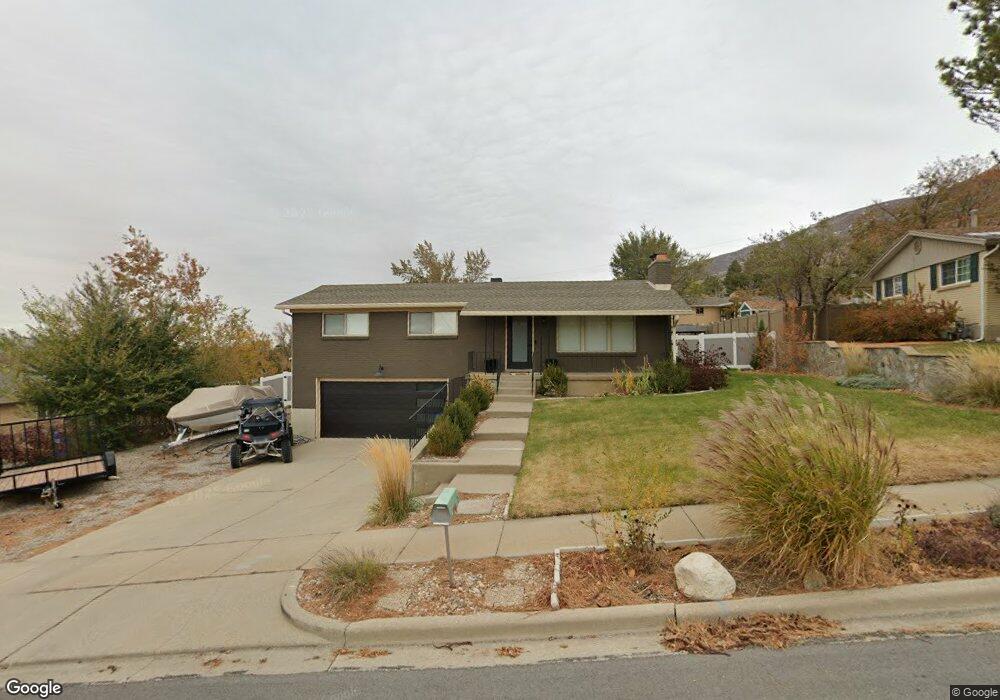
725 E 650 S Centerville, UT 84014
Estimated Value: $510,000 - $590,000
3
Beds
2
Baths
1,627
Sq Ft
$339/Sq Ft
Est. Value
About This Home
This home is located at 725 E 650 S, Centerville, UT 84014 and is currently estimated at $551,444, approximately $338 per square foot. 725 E 650 S is a home located in Davis County with nearby schools including J A Taylor Elementary School, Centerville Jr High, and Viewmont High School.
Ownership History
Date
Name
Owned For
Owner Type
Purchase Details
Closed on
Oct 2, 2024
Sold by
Loosle Andrew
Bought by
Cal Trust and Loosle
Current Estimated Value
Purchase Details
Closed on
May 13, 2020
Sold by
Bingham Colby Jay and Bingham Laurie A
Bought by
Loosle Andrew
Home Financials for this Owner
Home Financials are based on the most recent Mortgage that was taken out on this home.
Original Mortgage
$319,950
Interest Rate
3.3%
Mortgage Type
New Conventional
Purchase Details
Closed on
Sep 21, 2017
Sold by
Martin Nickolas E
Bought by
Bingham Colby Jay
Home Financials for this Owner
Home Financials are based on the most recent Mortgage that was taken out on this home.
Original Mortgage
$263,700
Interest Rate
3.86%
Mortgage Type
New Conventional
Purchase Details
Closed on
Sep 18, 2017
Sold by
Bingham Colby Jay
Bought by
Bingham Colby Jay and Bingham Laurie A
Home Financials for this Owner
Home Financials are based on the most recent Mortgage that was taken out on this home.
Original Mortgage
$263,700
Interest Rate
3.86%
Mortgage Type
New Conventional
Create a Home Valuation Report for This Property
The Home Valuation Report is an in-depth analysis detailing your home's value as well as a comparison with similar homes in the area
Purchase History
| Date | Buyer | Sale Price | Title Company |
|---|---|---|---|
| Cal Trust | -- | None Listed On Document | |
| Loosle Andrew | -- | North American Title | |
| Bingham Colby Jay | -- | -- | |
| Bingham Colby Jay | -- | Us Title |
Source: Public Records
Mortgage History
| Date | Status | Borrower | Loan Amount |
|---|---|---|---|
| Previous Owner | Loosle Andrew | $319,950 | |
| Previous Owner | Bingham Colby Jay | $263,700 |
Source: Public Records
Tax History
| Year | Tax Paid | Tax Assessment Tax Assessment Total Assessment is a certain percentage of the fair market value that is determined by local assessors to be the total taxable value of land and additions on the property. | Land | Improvement |
|---|---|---|---|---|
| 2025 | $2,812 | $268,950 | $168,312 | $100,638 |
| 2024 | $2,813 | $260,151 | $152,488 | $107,663 |
| 2023 | $2,583 | $454,000 | $248,546 | $205,454 |
| 2022 | $2,767 | $267,850 | $125,824 | $142,026 |
| 2021 | $2,454 | $370,000 | $193,796 | $176,204 |
| 2020 | $2,162 | $326,000 | $188,420 | $137,580 |
| 2019 | $2,072 | $305,000 | $185,990 | $119,010 |
| 2018 | $1,890 | $275,000 | $172,424 | $102,576 |
| 2016 | $1,465 | $118,415 | $59,465 | $58,950 |
| 2015 | $1,416 | $107,965 | $59,971 | $47,994 |
| 2014 | $159 | $117,738 | $59,971 | $57,767 |
| 2013 | -- | $110,410 | $49,115 | $61,295 |
Source: Public Records
Map
Nearby Homes
- 610 S 800 E
- 495 E 475 S
- 345 E 600 S
- 610 E Pages Ln
- 328 E 1100 S
- 360 E Center St
- 150 E 735 S Unit 23
- 967 S Courtyard Ln
- 252 N 400 E
- 16 W 780 S
- 662 E 1200 N
- 380 E 400 N
- 96 Village Square Rd
- 88 W 50 S Unit C-3
- 88 W 50 S Unit B5
- 1420 N Main St
- 975 E 1050 N
- 951 Centerville Commons Way
- 295 E 500 N
- 56 W 200 N
Your Personal Tour Guide
Ask me questions while you tour the home.