Estimated Value: $186,000 - $222,000
3
Beds
1
Bath
1,456
Sq Ft
$139/Sq Ft
Est. Value
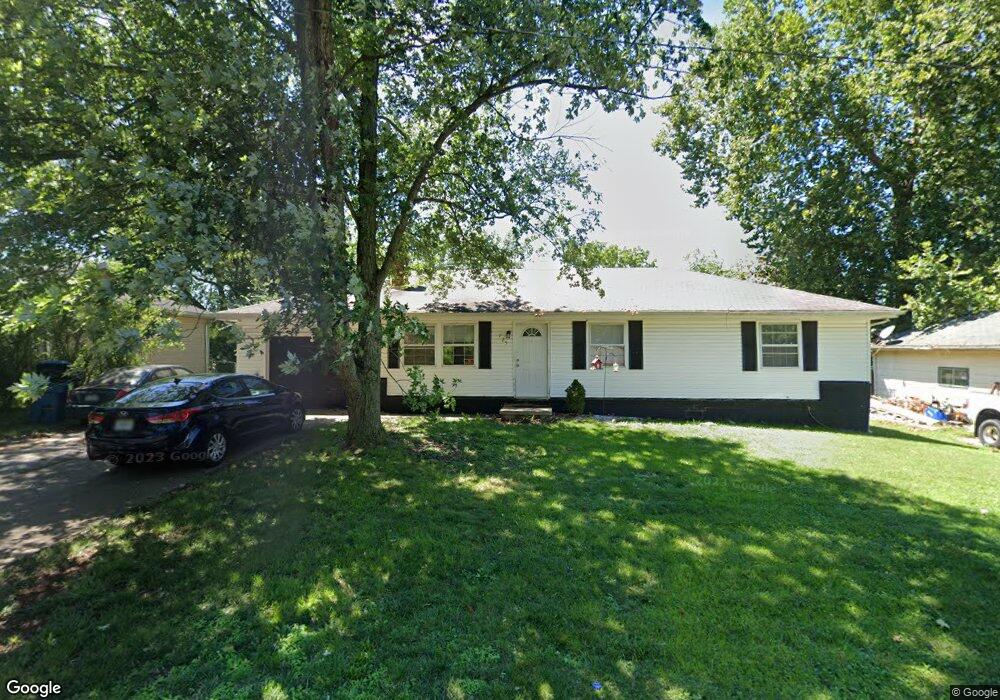
About This Home
This home is located at 725 Frank St, Nixa, MO 65714 and is currently estimated at $203,021, approximately $139 per square foot. 725 Frank St is a home located in Christian County with nearby schools including Summit Intermediate School, High Pointe Elementary School, and Nixa Junior High School.
Ownership History
Date
Name
Owned For
Owner Type
Purchase Details
Closed on
Oct 28, 2025
Sold by
Cleek Jeremiah Alan and Cleek Heather
Bought by
Michael John Properties Llc
Current Estimated Value
Purchase Details
Closed on
Mar 30, 2015
Sold by
Holmes John and Holmes Dezirae
Bought by
Cleek Heather and Cleek Jeremiah Alan
Home Financials for this Owner
Home Financials are based on the most recent Mortgage that was taken out on this home.
Original Mortgage
$76,530
Interest Rate
3.82%
Mortgage Type
New Conventional
Purchase Details
Closed on
Jan 2, 2013
Sold by
Holmes Daniel J
Bought by
Holmes John
Purchase Details
Closed on
Mar 30, 2011
Sold by
Mason Randolph T and Mason Rosalia
Bought by
Holmes Daniel J
Purchase Details
Closed on
Aug 13, 2007
Sold by
Mason Randolph T
Bought by
Mason Randolph T and Mason Rosalia
Create a Home Valuation Report for This Property
The Home Valuation Report is an in-depth analysis detailing your home's value as well as a comparison with similar homes in the area
Home Values in the Area
Average Home Value in this Area
Purchase History
| Date | Buyer | Sale Price | Title Company |
|---|---|---|---|
| Michael John Properties Llc | -- | Meridian Title | |
| Cleek Heather | -- | Titan Title And Closing Of M | |
| Holmes John | -- | None Available | |
| Holmes Daniel J | -- | None Available | |
| Mason Randolph T | -- | None Available |
Source: Public Records
Mortgage History
| Date | Status | Borrower | Loan Amount |
|---|---|---|---|
| Previous Owner | Cleek Heather | $76,530 |
Source: Public Records
Tax History
| Year | Tax Paid | Tax Assessment Tax Assessment Total Assessment is a certain percentage of the fair market value that is determined by local assessors to be the total taxable value of land and additions on the property. | Land | Improvement |
|---|---|---|---|---|
| 2025 | $1,073 | $18,300 | -- | -- |
| 2024 | $1,073 | $17,210 | -- | -- |
| 2023 | $1,073 | $17,210 | $0 | $0 |
| 2022 | $955 | $15,310 | $0 | $0 |
| 2021 | $956 | $15,310 | $0 | $0 |
| 2020 | $859 | $13,130 | $0 | $0 |
| 2019 | $859 | $13,130 | $0 | $0 |
| 2018 | $651 | $10,680 | $0 | $0 |
| 2017 | $651 | $10,680 | $0 | $0 |
| 2016 | $641 | $10,680 | $0 | $0 |
| 2015 | $642 | $10,680 | $10,680 | $0 |
| 2014 | $615 | $10,490 | $0 | $0 |
| 2013 | $6 | $10,490 | $0 | $0 |
| 2011 | $6 | $20,980 | $0 | $0 |
Source: Public Records
Map
Nearby Homes
- 107 Northview Rd
- 911 Brooke Ct
- 407 Slim Wilson Blvd
- 717 Hillcrest Ave
- 102 W Bennett St
- 701 Hillcrest Ave
- 607 Aspen Dr
- 907 Northview Dr
- 207 W Park St
- Lot 24 the Village of Cloverhill
- 603 E Thorn Hill Dr
- Lot 11 the Village of Cloverhill
- Lot 22 the Village of Cloverhill
- 410 N Prospect St
- Lot 12 the Village of Cloverhill
- Lot 30 the Village of Cloverhill
- Lot 26 the Village of Cloverhill
- 405 N Missouri Ave
- Lot 3 the Village of Cloverhill
- Lot 17 the Village of Cloverhill
Your Personal Tour Guide
Ask me questions while you tour the home.