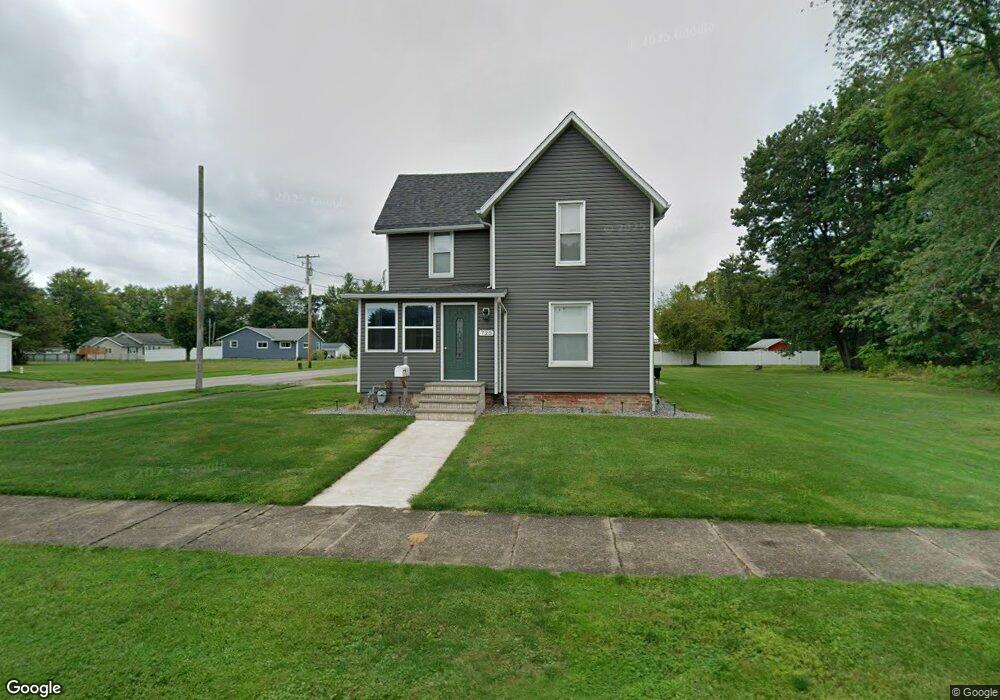
725 Grove St Conneaut, OH 44030
Estimated Value: $81,000 - $258,000
3
Beds
1
Bath
1,742
Sq Ft
$98/Sq Ft
Est. Value
About This Home
This home is located at 725 Grove St, Conneaut, OH 44030 and is currently estimated at $170,671, approximately $97 per square foot. 725 Grove St is a home located in Ashtabula County with nearby schools including Lakeshore Primary Elementary School, Gateway Elementary School, and Conneaut Middle School.
Ownership History
Date
Name
Owned For
Owner Type
Purchase Details
Closed on
Oct 19, 2006
Sold by
Harbor Properties Llc
Bought by
Blare Cory D
Current Estimated Value
Home Financials for this Owner
Home Financials are based on the most recent Mortgage that was taken out on this home.
Original Mortgage
$79,285
Outstanding Balance
$47,415
Interest Rate
6.5%
Mortgage Type
Unknown
Estimated Equity
$123,256
Purchase Details
Closed on
Nov 9, 2005
Sold by
Wells Fargo Bank Minnesota Na
Bought by
Harbor Properties Llc
Purchase Details
Closed on
Oct 19, 2005
Sold by
Smith Debra L and English Roger V
Bought by
Wells Fargo Bank Minnesota Na
Purchase Details
Closed on
Dec 11, 1997
Sold by
Kenneth V Keidel Trst
Bought by
Smith Deborah L
Home Financials for this Owner
Home Financials are based on the most recent Mortgage that was taken out on this home.
Original Mortgage
$38,500
Interest Rate
7.32%
Mortgage Type
New Conventional
Create a Home Valuation Report for This Property
The Home Valuation Report is an in-depth analysis detailing your home's value as well as a comparison with similar homes in the area
Home Values in the Area
Average Home Value in this Area
Purchase History
| Date | Buyer | Sale Price | Title Company |
|---|---|---|---|
| Blare Cory D | $78,500 | Midland Title | |
| Harbor Properties Llc | $27,000 | Sovereign Title Agency Inc | |
| Wells Fargo Bank Minnesota Na | $56,813 | None Available | |
| Smith Deborah L | $23,302 | -- |
Source: Public Records
Mortgage History
| Date | Status | Borrower | Loan Amount |
|---|---|---|---|
| Open | Blare Cory D | $79,285 | |
| Previous Owner | Smith Deborah L | $38,500 |
Source: Public Records
Tax History Compared to Growth
Tax History
| Year | Tax Paid | Tax Assessment Tax Assessment Total Assessment is a certain percentage of the fair market value that is determined by local assessors to be the total taxable value of land and additions on the property. | Land | Improvement |
|---|---|---|---|---|
| 2024 | $2,085 | $28,500 | $10,120 | $18,380 |
| 2023 | $1,351 | $28,500 | $10,120 | $18,380 |
| 2022 | $1,152 | $21,390 | $7,770 | $13,620 |
| 2021 | $1,171 | $21,390 | $7,770 | $13,620 |
| 2020 | $1,171 | $21,390 | $7,770 | $13,620 |
| 2019 | $1,543 | $27,730 | $6,970 | $20,760 |
| 2018 | $1,472 | $27,730 | $6,970 | $20,760 |
| 2017 | $735 | $27,730 | $6,970 | $20,760 |
| 2016 | $1,307 | $26,810 | $6,720 | $20,090 |
| 2015 | $1,321 | $26,810 | $6,720 | $20,090 |
| 2014 | $1,169 | $26,810 | $6,720 | $20,090 |
| 2013 | $967 | $22,790 | $6,370 | $16,420 |
Source: Public Records
Map
Nearby Homes
- 688 Grove St
- 703 Sandusky St
- 644 Mill St
- 716 Chestnut St
- 630 Mill St
- 770 Buffalo St
- 554 Sandusky St
- 794 Buffalo St
- 0 Chestnut St Unit 5120761
- 533 Mill St
- 536 Mill St
- 381 Bliss Ave
- 405 Bliss Ave
- 169 River St
- 281 Depot St
- 459 Mill St
- 448 Sandusky St Unit 450
- 429 Depot St
- 973 Buffalo St
- 179 Hayward Ave