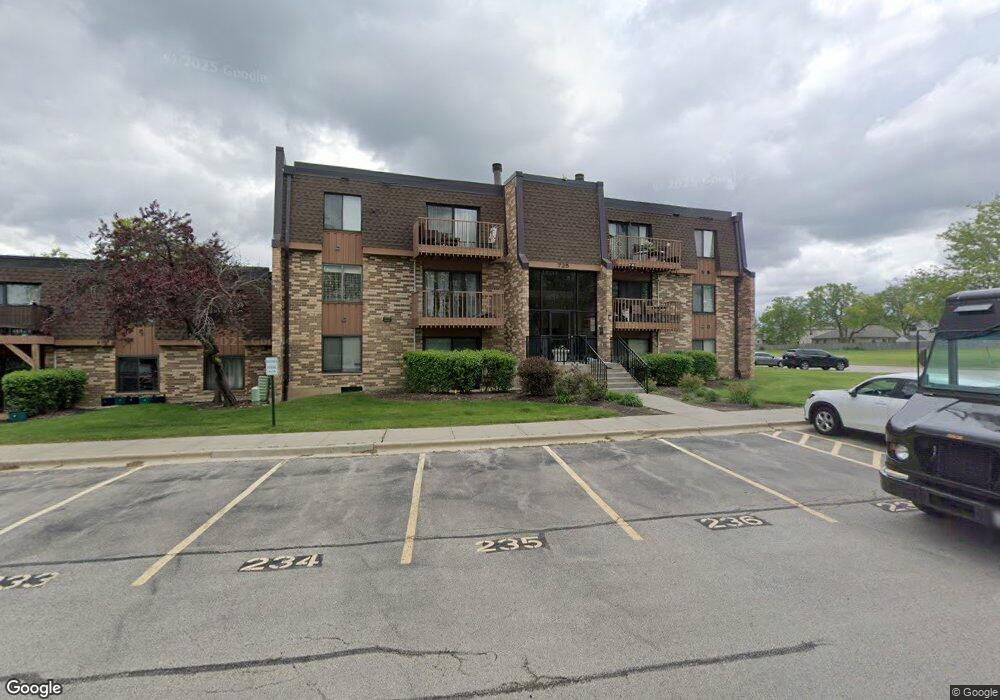
725 Limerick Ln Unit 7253B Schaumburg, IL 60193
South Schaumburg NeighborhoodEstimated Value: $129,000 - $181,000
1
Bed
--
Bath
825
Sq Ft
$200/Sq Ft
Est. Value
About This Home
This home is located at 725 Limerick Ln Unit 7253B, Schaumburg, IL 60193 and is currently estimated at $164,598, approximately $199 per square foot. 725 Limerick Ln Unit 7253B is a home located in Cook County with nearby schools including Edwin Aldrin Elementary School, Robert Frost Junior High School, and Schaumburg High School.
Ownership History
Date
Name
Owned For
Owner Type
Purchase Details
Closed on
Jan 28, 2021
Sold by
Filipov Gergana
Bought by
Kalita Halina and Kalita Gabriela
Current Estimated Value
Purchase Details
Closed on
Jun 24, 2015
Sold by
Caguingin
Bought by
Filipov Gergana
Purchase Details
Closed on
Mar 5, 2007
Sold by
Lankford Kenneth
Bought by
Caguingin Sandy
Purchase Details
Closed on
Mar 15, 2006
Sold by
Brakus Ned and Brakus Mina
Bought by
Lankford Kenneth and Caguingin Sandy
Home Financials for this Owner
Home Financials are based on the most recent Mortgage that was taken out on this home.
Original Mortgage
$137,735
Interest Rate
6.38%
Mortgage Type
FHA
Purchase Details
Closed on
Oct 17, 2000
Sold by
Lasalle Bank National Assn
Bought by
Brakus Ned and Brakus Mina
Home Financials for this Owner
Home Financials are based on the most recent Mortgage that was taken out on this home.
Original Mortgage
$39,000
Interest Rate
7.77%
Create a Home Valuation Report for This Property
The Home Valuation Report is an in-depth analysis detailing your home's value as well as a comparison with similar homes in the area
Home Values in the Area
Average Home Value in this Area
Purchase History
| Date | Buyer | Sale Price | Title Company |
|---|---|---|---|
| Kalita Halina | $95,000 | Burnet Title Post Closing | |
| Filipov Gergana | $44,000 | Attorney | |
| Caguingin Sandy | -- | None Available | |
| Lankford Kenneth | $140,000 | Pntn | |
| Brakus Ned | $52,000 | -- |
Source: Public Records
Mortgage History
| Date | Status | Borrower | Loan Amount |
|---|---|---|---|
| Previous Owner | Lankford Kenneth | $137,735 | |
| Previous Owner | Brakus Ned | $39,000 |
Source: Public Records
Tax History Compared to Growth
Tax History
| Year | Tax Paid | Tax Assessment Tax Assessment Total Assessment is a certain percentage of the fair market value that is determined by local assessors to be the total taxable value of land and additions on the property. | Land | Improvement |
|---|---|---|---|---|
| 2024 | $2,424 | $11,968 | $1,861 | $10,107 |
| 2023 | $2,322 | $11,968 | $1,861 | $10,107 |
| 2022 | $2,322 | $11,968 | $1,861 | $10,107 |
| 2021 | $1,972 | $9,838 | $1,262 | $8,576 |
| 2020 | $2,006 | $9,838 | $1,262 | $8,576 |
| 2019 | $2,032 | $11,009 | $1,262 | $9,747 |
| 2018 | $1,090 | $7,067 | $1,129 | $5,938 |
| 2017 | $1,090 | $7,067 | $1,129 | $5,938 |
| 2016 | $1,262 | $7,067 | $1,129 | $5,938 |
| 2015 | $1,241 | $6,770 | $996 | $5,774 |
| 2014 | $1,243 | $6,770 | $996 | $5,774 |
| 2013 | $1,194 | $6,770 | $996 | $5,774 |
Source: Public Records
Map
Nearby Homes
- 635 Limerick Ln Unit 2B
- 631 Derry Ct Unit 3C
- 733 Limerick Ln Unit 7333D
- 722 Tipperary Ct Unit 3D
- 712 Tipperary Ct Unit 1C
- 711 Tipperary Ct Unit 2D
- 620 Tralee Ct Unit 3B
- 620 Tralee Ct Unit 3A
- 614 Tralee Ct Unit 2-C
- 553 Stone Gate Cir
- 712 Dante Ct
- 36 Shore Dr
- 415 Laconia Ln
- 126 Manchester Ct Unit 61B
- 916 Manchester Cir Unit 91A
- 300 S Roselle Rd Unit 207
- 300 S Roselle Rd Unit 519
- 300 S Roselle Rd Unit 419
- 412 Redwood Ln
- 226 Timbercrest Dr
- 721 Limerick Ln Unit 1C
- 725 Limerick Ln Unit 2A
- 729 Limerick Ln Unit 1B
- 721 Limerick Ln Unit 7211C
- 721 Limerick Ln Unit 7212D
- 721 Limerick Ln Unit 7211D
- 729 Limerick Ln Unit 7292A
- 725 Limerick Ln Unit 7251C
- 729 Limerick Ln Unit 7291C
- 721 Limerick Ln Unit 7211B
- 729 Limerick Ln Unit 7291B
- 725 Limerick Ln Unit 7251D
- 721 Limerick Ln Unit 7212A
- 725 Limerick Ln Unit 7252B
- 721 Limerick Ln Unit 7212B
- 725 Limerick Ln Unit 7251A
- 725 Limerick Ln Unit 7251B
- 729 Limerick Ln Unit 7291A
- 725 Limerick Ln Unit 7252C
- 725 Limerick Ln Unit 7253C