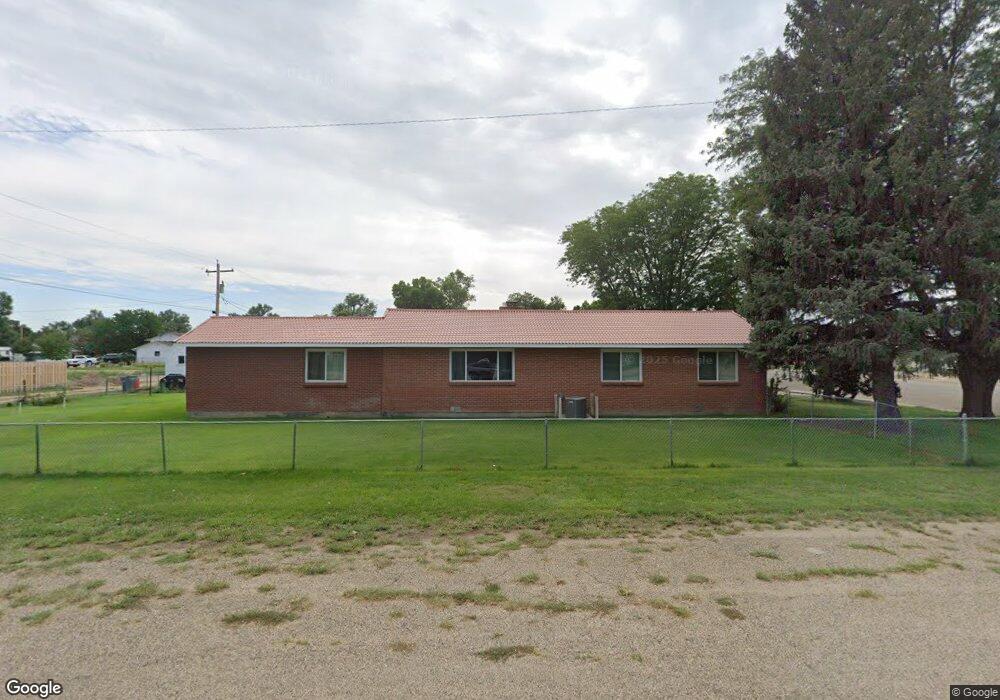
725 Main St Ordway, CO 81063
Estimated Value: $221,000 - $285,000
4
Beds
2
Baths
2,667
Sq Ft
$91/Sq Ft
Est. Value
About This Home
This home is located at 725 Main St, Ordway, CO 81063 and is currently estimated at $243,905, approximately $91 per square foot. 725 Main St is a home with nearby schools including Crowley County Ward Intermediate and Crowley County Junior & Senior High School.
Ownership History
Date
Name
Owned For
Owner Type
Purchase Details
Closed on
Mar 22, 2016
Sold by
Ritter Patricia L
Bought by
Ritter Patricia L Living Trust 12/20/10
Current Estimated Value
Purchase Details
Closed on
Mar 25, 2010
Sold by
Ritter Patricia L
Bought by
Beneficiary Deed
Purchase Details
Closed on
Feb 4, 2010
Sold by
Mcdonell Charlotte J
Bought by
Death Certificate
Purchase Details
Closed on
Jan 27, 2010
Sold by
Mcdonell Charlotte J
Bought by
Letters Testamentary
Create a Home Valuation Report for This Property
The Home Valuation Report is an in-depth analysis detailing your home's value as well as a comparison with similar homes in the area
Purchase History
We collect this data history from publicly available records. To have your information removed, we recommend requesting removal directly through your county’s website.
| Date | Buyer | Sale Price | Title Company |
|---|---|---|---|
| Ritter Patricia L Living Trust 12/20/10 | -- | -- | |
| Beneficiary Deed | -- | -- | |
| Ritter Patricia L | $75,000 | -- | |
| Death Certificate | -- | -- | |
| Letters Testamentary | -- | -- |
Source: Public Records
Tax History
| Year | Tax Paid | Tax Assessment Tax Assessment Total Assessment is a certain percentage of the fair market value that is determined by local assessors to be the total taxable value of land and additions on the property. | Land | Improvement |
|---|---|---|---|---|
| 2025 | $511 | $13,205 | $170 | $13,035 |
| 2024 | $511 | $10,465 | $134 | $10,331 |
| 2023 | $507 | $10,465 | $134 | $10,331 |
| 2022 | $879 | $9,416 | $188 | $9,228 |
| 2021 | $863 | $9,686 | $193 | $9,493 |
| 2020 | $833 | $9,686 | $193 | $9,493 |
| 2019 | $892 | $9,686 | $193 | $9,493 |
| 2018 | $636 | $6,694 | $194 | $6,500 |
| 2017 | $622 | $6,694 | $194 | $6,500 |
| 2016 | $630 | $7,410 | $220 | $7,190 |
| 2015 | $650 | $7,410 | $220 | $7,190 |
| 2014 | $650 | $7,410 | $220 | $7,190 |
| 2013 | $644 | $7,410 | $220 | $7,190 |
| 2012 | $652 | $7,410 | $220 | $7,190 |
Source: Public Records
Map
Nearby Homes
Your Personal Tour Guide
Ask me questions while you tour the home.