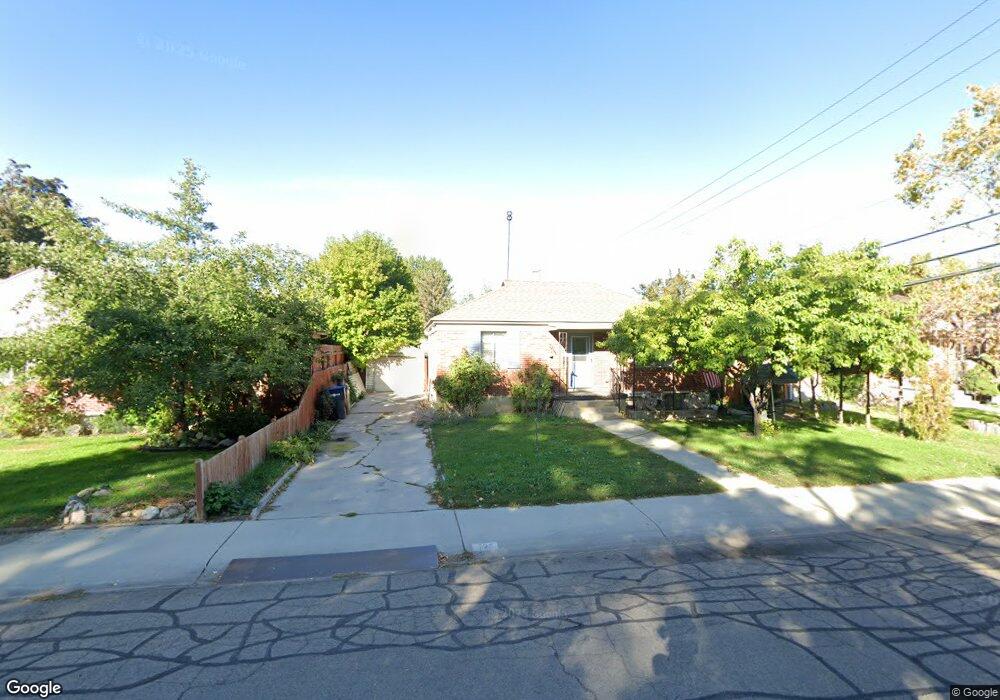
725 N 380 W Provo, UT 84601
Rivergrove NeighborhoodEstimated Value: $432,000 - $478,000
2
Beds
2
Baths
850
Sq Ft
$531/Sq Ft
Est. Value
About This Home
This home is located at 725 N 380 W, Provo, UT 84601 and is currently estimated at $450,948, approximately $530 per square foot. 725 N 380 W is a home located in Utah County with nearby schools including Timpanogos Elementary School, Dixon Middle School, and Provo High School.
Ownership History
Date
Name
Owned For
Owner Type
Purchase Details
Closed on
Dec 11, 2024
Sold by
Bjarnson Family Trust and Bjarnson Larry
Bought by
Farley Mary and Roney Liliana
Current Estimated Value
Home Financials for this Owner
Home Financials are based on the most recent Mortgage that was taken out on this home.
Original Mortgage
$230,925
Outstanding Balance
$229,084
Interest Rate
6.72%
Mortgage Type
New Conventional
Estimated Equity
$221,864
Purchase Details
Closed on
Jul 25, 2002
Sold by
Hanrichson Development
Bought by
Thatcher Devar S and Thatcher Charlotte C
Create a Home Valuation Report for This Property
The Home Valuation Report is an in-depth analysis detailing your home's value as well as a comparison with similar homes in the area
Home Values in the Area
Average Home Value in this Area
Purchase History
| Date | Buyer | Sale Price | Title Company |
|---|---|---|---|
| Farley Mary | -- | Highland Title | |
| Thatcher Devar S | -- | Century Title |
Source: Public Records
Mortgage History
| Date | Status | Borrower | Loan Amount |
|---|---|---|---|
| Open | Farley Mary | $230,925 |
Source: Public Records
Tax History Compared to Growth
Tax History
| Year | Tax Paid | Tax Assessment Tax Assessment Total Assessment is a certain percentage of the fair market value that is determined by local assessors to be the total taxable value of land and additions on the property. | Land | Improvement |
|---|---|---|---|---|
| 2025 | $2,336 | $242,880 | $194,100 | $247,500 |
| 2024 | $2,336 | $229,955 | $0 | $0 |
| 2023 | $2,369 | $229,845 | $0 | $0 |
| 2022 | $2,311 | $226,105 | $0 | $0 |
| 2021 | $1,683 | $287,200 | $115,900 | $171,300 |
| 2020 | $1,632 | $261,100 | $105,400 | $155,700 |
| 2019 | $1,490 | $247,900 | $92,200 | $155,700 |
| 2018 | $1,340 | $226,100 | $88,900 | $137,200 |
| 2017 | $1,196 | $110,880 | $0 | $0 |
| 2016 | $1,116 | $96,415 | $0 | $0 |
| 2015 | $995 | $86,900 | $0 | $0 |
| 2014 | $888 | $80,850 | $0 | $0 |
Source: Public Records
Map
Nearby Homes
- 556 W 800 N Unit 18
- 810 N 600 W
- 828 N 600 W
- 595 N 600 W
- 361 N 300 W Unit 201
- 614 W 400 N
- 620 N 800 W
- 836 N University Ave Unit 111
- 270 N 400 W
- 440 N 800 W
- 548 N 850 W
- 209 N 400 W
- 266 N 700 W
- 250 N 100 W Unit 109
- 902 W 500 N
- 952 N 1000 W Unit 2
- 136 E 400 N Unit 107
- 75 E 200 N Unit 106
- 466 N 200 E
- 1149 N 850 W