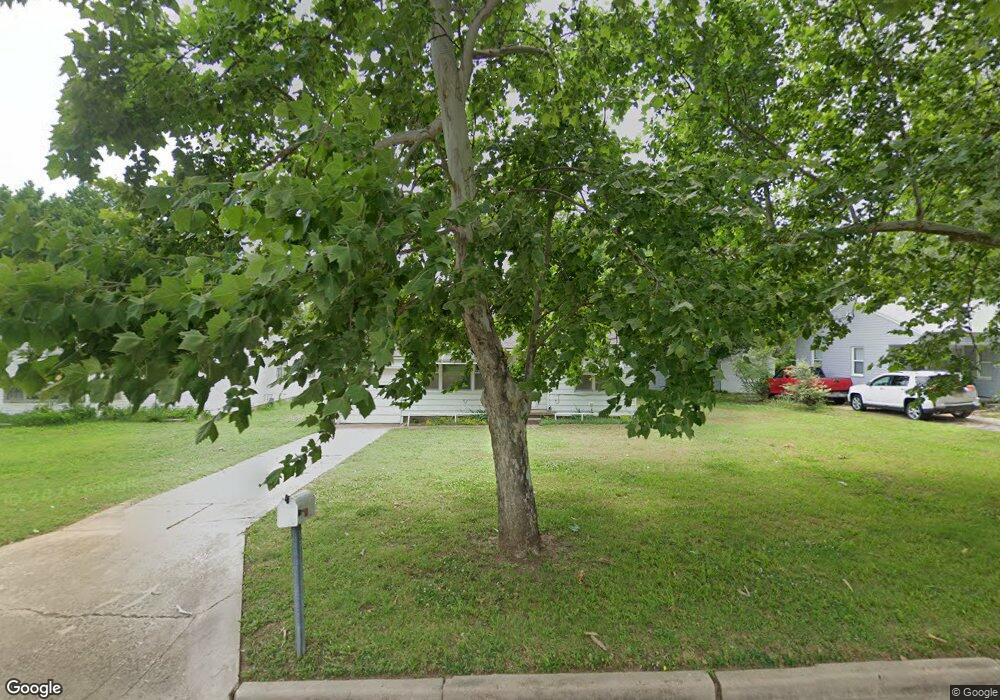
725 N Birch St Ponca City, OK 74601
Estimated Value: $57,000 - $68,000
2
Beds
1
Bath
883
Sq Ft
$71/Sq Ft
Est. Value
About This Home
This home is located at 725 N Birch St, Ponca City, OK 74601 and is currently estimated at $62,282, approximately $70 per square foot. 725 N Birch St is a home located in Kay County with nearby schools including Liberty Elementary School, Ponca City West Middle School, and Ponca City East Middle School.
Ownership History
Date
Name
Owned For
Owner Type
Purchase Details
Closed on
Aug 8, 2023
Sold by
Cjs Properties Llc
Bought by
Miller Charles Randall and Miller Tricia Ann
Current Estimated Value
Home Financials for this Owner
Home Financials are based on the most recent Mortgage that was taken out on this home.
Original Mortgage
$52,000
Outstanding Balance
$47,272
Interest Rate
6.06%
Mortgage Type
New Conventional
Estimated Equity
$15,010
Purchase Details
Closed on
Jan 1, 2017
Sold by
Sattre Christopher and Sattre Judith
Bought by
Cj S Properties Llc
Purchase Details
Closed on
Jun 17, 1988
Sold by
Thelma L Norris
Bought by
Sattre Christopher A and Sattre J
Create a Home Valuation Report for This Property
The Home Valuation Report is an in-depth analysis detailing your home's value as well as a comparison with similar homes in the area
Home Values in the Area
Average Home Value in this Area
Purchase History
| Date | Buyer | Sale Price | Title Company |
|---|---|---|---|
| Miller Charles Randall | $52,000 | None Listed On Document | |
| Cj S Properties Llc | $101 | None Available | |
| Sattre Christopher A | $12,000 | -- |
Source: Public Records
Mortgage History
| Date | Status | Borrower | Loan Amount |
|---|---|---|---|
| Open | Miller Charles Randall | $52,000 |
Source: Public Records
Tax History Compared to Growth
Tax History
| Year | Tax Paid | Tax Assessment Tax Assessment Total Assessment is a certain percentage of the fair market value that is determined by local assessors to be the total taxable value of land and additions on the property. | Land | Improvement |
|---|---|---|---|---|
| 2024 | $541 | $5,719 | $433 | $5,286 |
| 2023 | $541 | $2,582 | $433 | $2,149 |
| 2022 | $234 | $2,459 | $433 | $2,026 |
| 2021 | $235 | $2,459 | $433 | $2,026 |
| 2020 | $233 | $2,459 | $433 | $2,026 |
| 2019 | $224 | $2,346 | $433 | $1,913 |
| 2018 | $230 | $2,375 | $433 | $1,942 |
| 2017 | $233 | $2,375 | $433 | $1,942 |
| 2016 | $235 | $2,375 | $433 | $1,942 |
| 2015 | $228 | $2,294 | $433 | $1,861 |
| 2014 | $213 | $2,185 | $433 | $1,752 |
Source: Public Records
Map
Nearby Homes