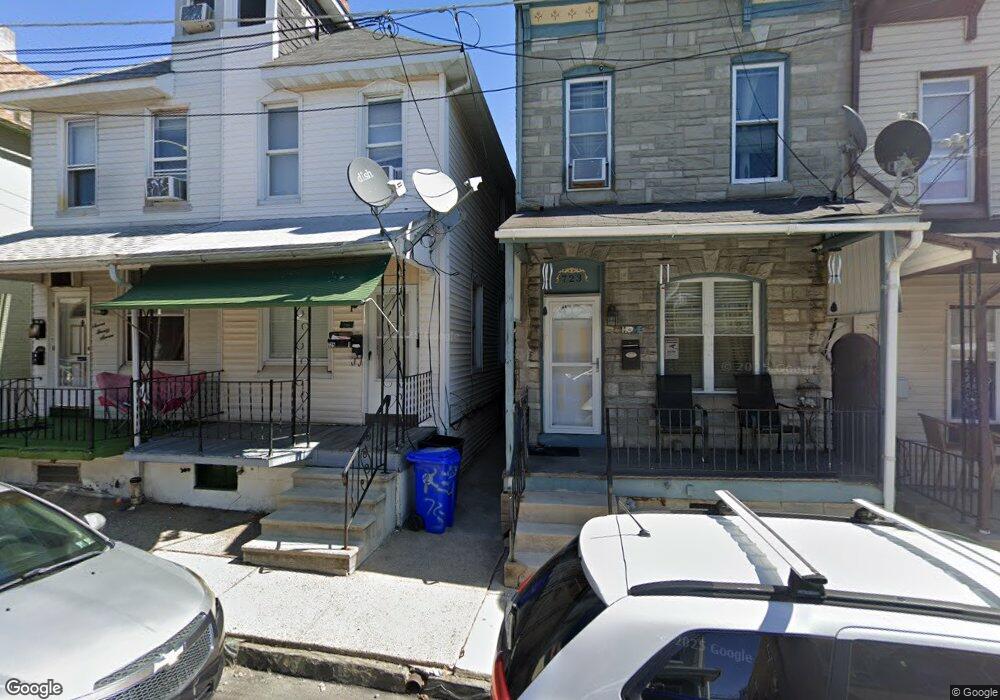
725 Pear St Unit 2 Reading, PA 19601
Northwest Reading NeighborhoodEstimated Value: $199,000 - $234,155
4
Beds
1
Bath
1,918
Sq Ft
$110/Sq Ft
Est. Value
About This Home
This home is located at 725 Pear St Unit 2, Reading, PA 19601 and is currently estimated at $211,039, approximately $110 per square foot. 725 Pear St Unit 2 is a home located in Berks County with nearby schools including Riverside Elementary School, Northwest Middle School, and Reading Senior High School.
Ownership History
Date
Name
Owned For
Owner Type
Purchase Details
Closed on
Mar 21, 2022
Sold by
Cesar Deleon
Bought by
Jimenez Liyeidy J Taveras
Current Estimated Value
Home Financials for this Owner
Home Financials are based on the most recent Mortgage that was taken out on this home.
Original Mortgage
$156,120
Outstanding Balance
$146,255
Interest Rate
4.16%
Mortgage Type
FHA
Estimated Equity
$64,784
Purchase Details
Closed on
Jul 30, 2010
Sold by
Secretary Of Housing & Urban Development and Davis Laura
Bought by
Deleon Cesar and Deleon Mirian
Purchase Details
Closed on
May 18, 2010
Sold by
Citimortgage Inc
Bought by
Secretary Of Housing & Urban Development
Purchase Details
Closed on
Oct 29, 2009
Sold by
Alfiero Kristy A
Bought by
Citimortgage Inc
Purchase Details
Closed on
Jun 14, 2002
Sold by
Stankiewicz Stacie C and George Cornelius A
Bought by
Alfiero Kristy A
Home Financials for this Owner
Home Financials are based on the most recent Mortgage that was taken out on this home.
Original Mortgage
$33,075
Interest Rate
6.81%
Mortgage Type
FHA
Create a Home Valuation Report for This Property
The Home Valuation Report is an in-depth analysis detailing your home's value as well as a comparison with similar homes in the area
Home Values in the Area
Average Home Value in this Area
Purchase History
| Date | Buyer | Sale Price | Title Company |
|---|---|---|---|
| Jimenez Liyeidy J Taveras | $159,000 | None Listed On Document | |
| Deleon Cesar | $11,000 | None Available | |
| Secretary Of Housing & Urban Development | $1,700 | None Available | |
| Citimortgage Inc | $1,700 | None Available | |
| Alfiero Kristy A | $33,000 | -- |
Source: Public Records
Mortgage History
| Date | Status | Borrower | Loan Amount |
|---|---|---|---|
| Open | Jimenez Liyeidy J Taveras | $156,120 | |
| Previous Owner | Alfiero Kristy A | $33,075 | |
| Closed | Jimenez Liyeidy J Taveras | $7,950 |
Source: Public Records
Tax History Compared to Growth
Tax History
| Year | Tax Paid | Tax Assessment Tax Assessment Total Assessment is a certain percentage of the fair market value that is determined by local assessors to be the total taxable value of land and additions on the property. | Land | Improvement |
|---|---|---|---|---|
| 2025 | $1,132 | $41,700 | $9,600 | $32,100 |
| 2024 | $1,852 | $41,700 | $9,600 | $32,100 |
| 2023 | $1,823 | $41,700 | $9,600 | $32,100 |
| 2022 | $1,823 | $41,700 | $9,600 | $32,100 |
| 2021 | $1,823 | $41,700 | $9,600 | $32,100 |
| 2020 | $1,805 | $41,700 | $9,600 | $32,100 |
| 2019 | $1,805 | $41,700 | $9,600 | $32,100 |
| 2018 | $1,805 | $41,700 | $9,600 | $32,100 |
| 2017 | $1,793 | $41,700 | $9,600 | $32,100 |
| 2016 | $748 | $41,700 | $9,600 | $32,100 |
| 2015 | $1,024 | $41,700 | $9,600 | $32,100 |
| 2014 | $942 | $41,700 | $9,600 | $32,100 |
Source: Public Records
Map
Nearby Homes
- 112 Windsor St
- 633 N Front St
- 122 W Oley St
- 325 Douglass St
- 922 Pear St
- 833 Rose St
- 125 W Windsor St
- 217 Hudson St
- 225 Hudson St
- 202 Hudson St
- 515 N Front St
- 725 Madison Ave
- 927 N 4th St
- 258 Jameson Place
- 301 W Douglass St
- 308 Hollenbach St
- 542 N 5th St
- 1020 Madison Ave
- 817 Church St
- 516 Schuylkill Ave