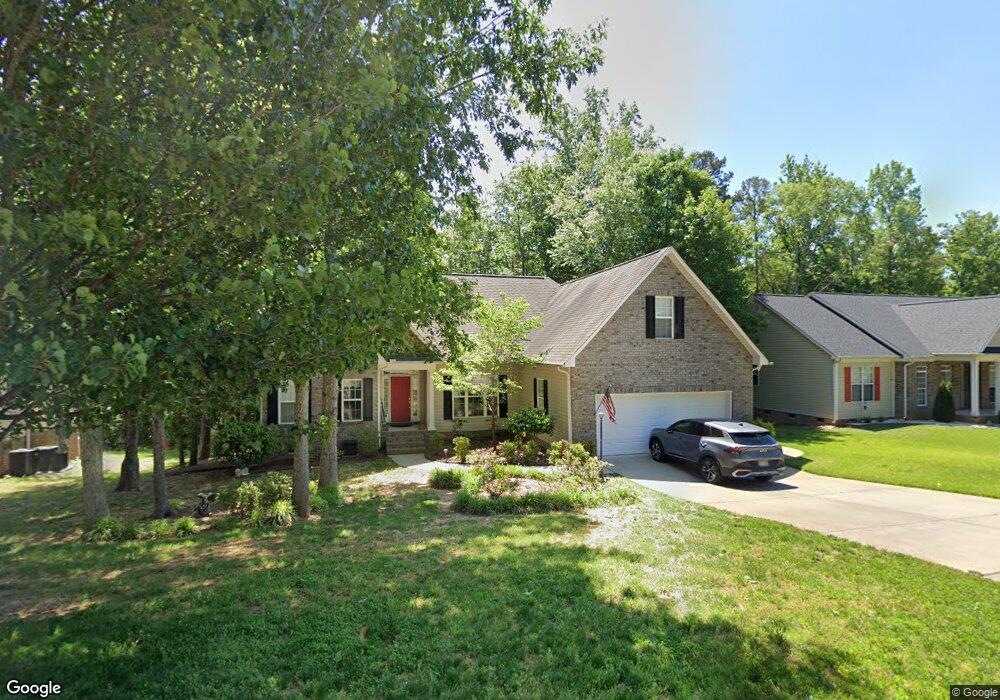
725 Redah Ave Locust, NC 28097
Estimated Value: $425,000 - $476,000
3
Beds
2
Baths
2,201
Sq Ft
$202/Sq Ft
Est. Value
About This Home
This home is located at 725 Redah Ave, Locust, NC 28097 and is currently estimated at $445,185, approximately $202 per square foot. 725 Redah Ave is a home located in Stanly County with nearby schools including Stanfield Elementary School, West Stanly Middle School, and West Stanly High School.
Ownership History
Date
Name
Owned For
Owner Type
Purchase Details
Closed on
Jul 3, 2020
Sold by
Fitzgerald Joyce A
Bought by
Cugini Nancy D and Cugini Douglas C
Current Estimated Value
Home Financials for this Owner
Home Financials are based on the most recent Mortgage that was taken out on this home.
Original Mortgage
$258,236
Outstanding Balance
$229,411
Interest Rate
3.2%
Mortgage Type
FHA
Estimated Equity
$215,774
Purchase Details
Closed on
Sep 8, 2006
Sold by
Benton Custom Homes Inc
Bought by
Fitzgerald Arthur H and Fitzgerald Joyce A
Home Financials for this Owner
Home Financials are based on the most recent Mortgage that was taken out on this home.
Original Mortgage
$120,000
Interest Rate
5.75%
Mortgage Type
Adjustable Rate Mortgage/ARM
Purchase Details
Closed on
May 19, 2005
Sold by
Bbs Builders Inc
Bought by
Benton Custom Homes Inc
Create a Home Valuation Report for This Property
The Home Valuation Report is an in-depth analysis detailing your home's value as well as a comparison with similar homes in the area
Home Values in the Area
Average Home Value in this Area
Purchase History
We collect this data history from publicly available records. To have your information removed, we recommend requesting removal directly through your county’s website.
| Date | Buyer | Sale Price | Title Company |
|---|---|---|---|
| Cugini Nancy D | $263,000 | Carolina Title Company Inc | |
| Fitzgerald Arthur H | $215,000 | None Available | |
| Benton Custom Homes Inc | $33,000 | None Available |
Source: Public Records
Mortgage History
We collect this data history from publicly available records. To have your information removed, we recommend requesting removal directly through your county’s website.
| Date | Status | Borrower | Loan Amount |
|---|---|---|---|
| Open | Cugini Nancy D | $258,236 | |
| Previous Owner | Fitzgerald Arthur H | $120,000 |
Source: Public Records
Tax History
| Year | Tax Paid | Tax Assessment Tax Assessment Total Assessment is a certain percentage of the fair market value that is determined by local assessors to be the total taxable value of land and additions on the property. | Land | Improvement |
|---|---|---|---|---|
| 2025 | $3,215 | $349,432 | $65,000 | $284,432 |
| 2024 | $2,867 | $262,987 | $44,000 | $218,987 |
| 2023 | $2,987 | $262,987 | $44,000 | $218,987 |
| 2022 | $2,960 | $262,987 | $44,000 | $218,987 |
| 2021 | $2,934 | $262,987 | $44,000 | $218,987 |
| 2020 | $2,388 | $202,827 | $25,000 | $177,827 |
| 2019 | $2,412 | $202,827 | $25,000 | $177,827 |
| 2018 | $2,292 | $202,827 | $25,000 | $177,827 |
| 2017 | $2,292 | $202,827 | $25,000 | $177,827 |
| 2016 | $2,302 | $203,718 | $30,000 | $173,718 |
| 2015 | $2,414 | $203,718 | $30,000 | $173,718 |
| 2014 | $2,385 | $203,718 | $30,000 | $173,718 |
Source: Public Records
Map
Nearby Homes
- 407 N Carolina 200
- 27 Berea Baptist Church Rd
- 103 Berea Baptist Church Rd
- 402 Church St
- 106 Hilltop St
- 110 E Sunset Dr
- 201 Oak St
- 135 Water Oak Ln
- 606 Elm St
- 4034 N Carolina 200
- 455 Saddlebred Ln
- 00 W Stanly St
- 417 Kiser Ln
- 425 Kiser Ln
- 316 Meadow Creek Church Rd
- 526 Ardsley Dr
- 288 Harrison Ln
- 177 Park View Dr
- 664 Saddlebred Ln
- 556 Big Lick Rd
- 725 Redah Ave Unit 13
- 723 Redah Ave
- 723 Redah Ave Unit 12
- 727 Redah Ave
- 729 Redah Ave
- 729 Redah Ave Unit 15
- 721 Redah Ave
- 724 Redah Ave
- 726 Redah Ave
- 722 Redah Ave
- 731 Redah Ave
- 719 Redah Ave
- 719 Redah Ave Unit 10
- 728 Redah Ave
- 200 Elizabeth Dr
- 720 Redah Ave
- 718 Redah Ave
- 730 Redah Ave
- 730 Redah Ave Unit 26
- 733 Redah Ave
Your Personal Tour Guide
Ask me questions while you tour the home.