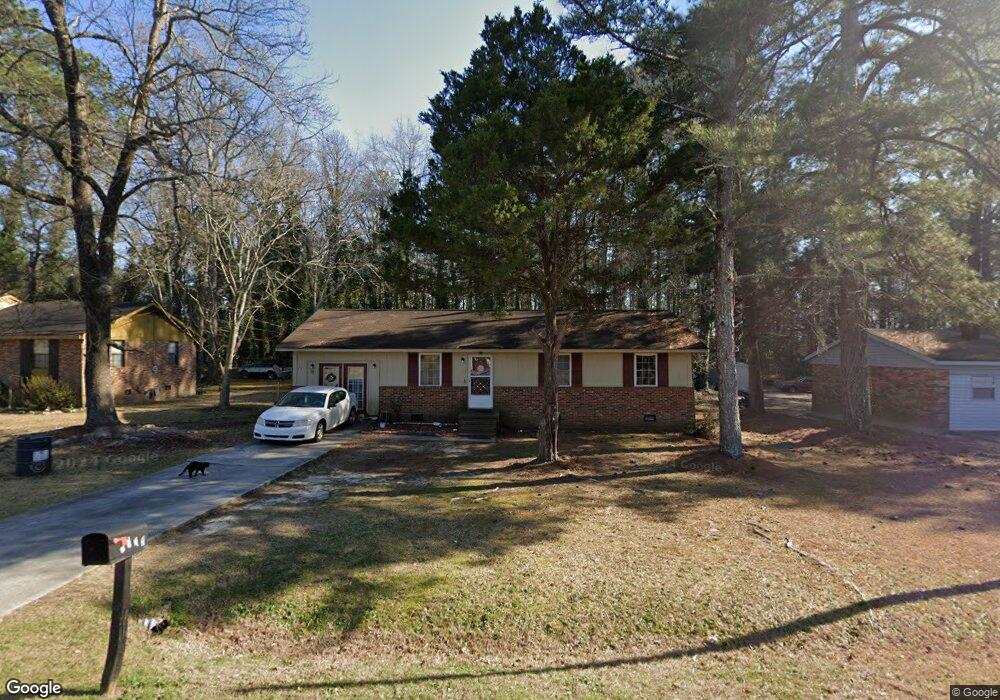
725 Robin St Thomson, GA 30824
Estimated Value: $125,815 - $162,000
3
Beds
2
Baths
1,275
Sq Ft
$111/Sq Ft
Est. Value
About This Home
This home is located at 725 Robin St, Thomson, GA 30824 and is currently estimated at $141,454, approximately $110 per square foot. 725 Robin St is a home located in McDuffie County with nearby schools including Thomson High School and Briarwood Academy.
Ownership History
Date
Name
Owned For
Owner Type
Purchase Details
Closed on
Jan 12, 2007
Sold by
Usa
Bought by
Brown Tamara R
Current Estimated Value
Home Financials for this Owner
Home Financials are based on the most recent Mortgage that was taken out on this home.
Original Mortgage
$64,272
Outstanding Balance
$41,277
Interest Rate
6.08%
Mortgage Type
New Conventional
Estimated Equity
$100,177
Purchase Details
Closed on
Nov 1, 2005
Sold by
Mcgahee Lelon J
Bought by
United States Of America
Purchase Details
Closed on
Apr 19, 1989
Bought by
Mcgahee Lelon J
Create a Home Valuation Report for This Property
The Home Valuation Report is an in-depth analysis detailing your home's value as well as a comparison with similar homes in the area
Home Values in the Area
Average Home Value in this Area
Purchase History
| Date | Buyer | Sale Price | Title Company |
|---|---|---|---|
| Brown Tamara R | $44,000 | -- | |
| United States Of America | -- | -- | |
| Mcgahee Lelon J | $32,500 | -- |
Source: Public Records
Mortgage History
| Date | Status | Borrower | Loan Amount |
|---|---|---|---|
| Open | Brown Tamara R | $64,272 | |
| Closed | Brown Tamara R | $10,000 |
Source: Public Records
Tax History
| Year | Tax Paid | Tax Assessment Tax Assessment Total Assessment is a certain percentage of the fair market value that is determined by local assessors to be the total taxable value of land and additions on the property. | Land | Improvement |
|---|---|---|---|---|
| 2025 | $1,280 | $44,772 | $2,388 | $42,384 |
| 2024 | $1,280 | $42,631 | $2,320 | $40,311 |
| 2023 | $1,260 | $40,909 | $2,200 | $38,709 |
| 2022 | $1,086 | $34,594 | $2,200 | $32,394 |
| 2021 | $866 | $27,870 | $2,200 | $25,670 |
| 2020 | $756 | $24,755 | $2,272 | $22,483 |
| 2019 | $762 | $24,755 | $2,272 | $22,483 |
| 2018 | $769 | $24,755 | $2,272 | $22,483 |
| 2017 | $749 | $24,755 | $2,272 | $22,483 |
| 2016 | $754 | $24,755 | $2,272 | $22,483 |
| 2015 | $711 | $26,211 | $2,272 | $23,939 |
| 2014 | $714 | $26,211 | $2,272 | $23,939 |
| 2013 | -- | $28,050 | $2,272 | $25,778 |
Source: Public Records
Map
Nearby Homes
Your Personal Tour Guide
Ask me questions while you tour the home.