
Seller's Agent in 2022
Nile Altman
Waddell Haskin & Green Realty, LLC
(706) 315-2995
14 in this area
73 Total Sales
Estimated Value: $227,000 - $253,000
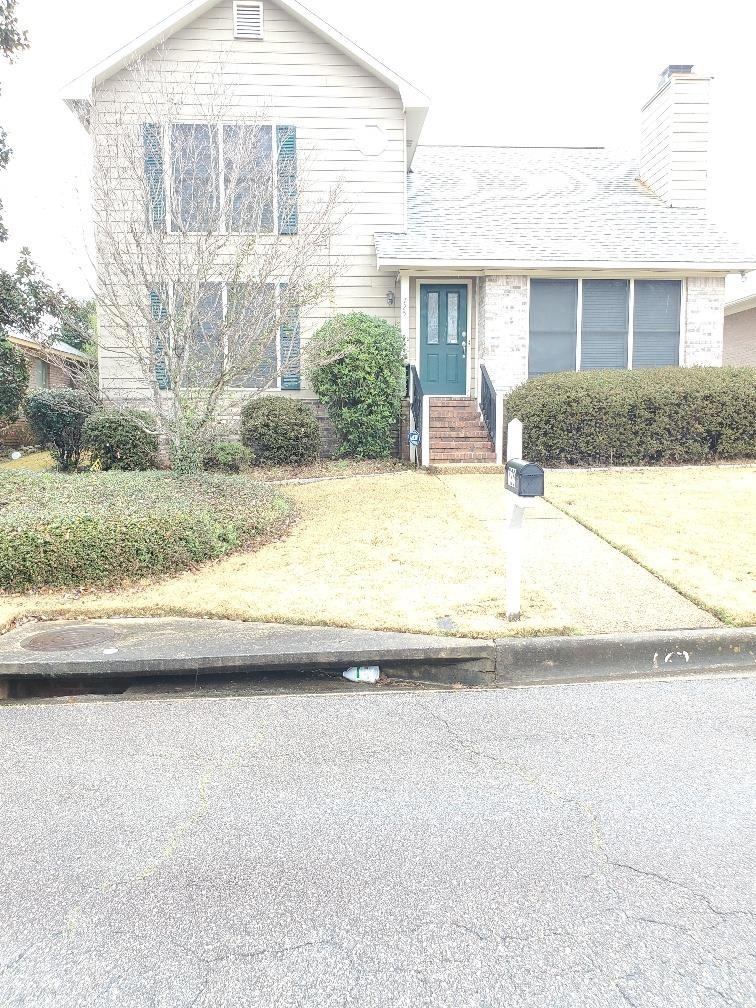
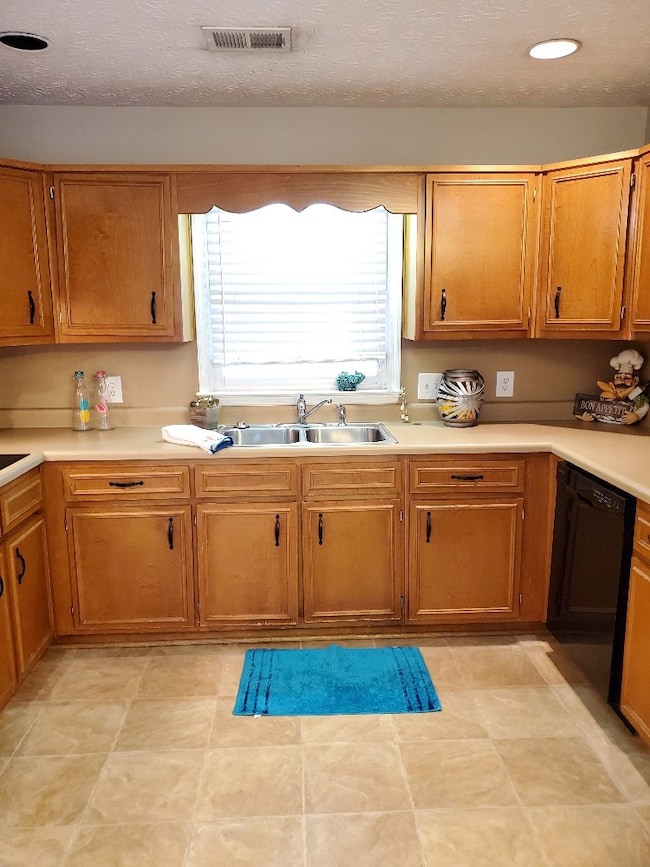
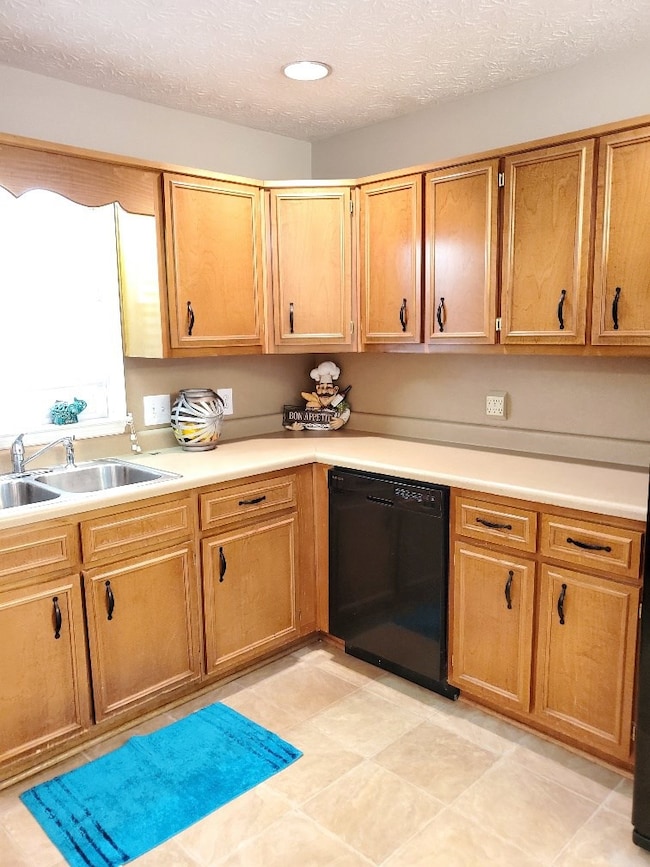
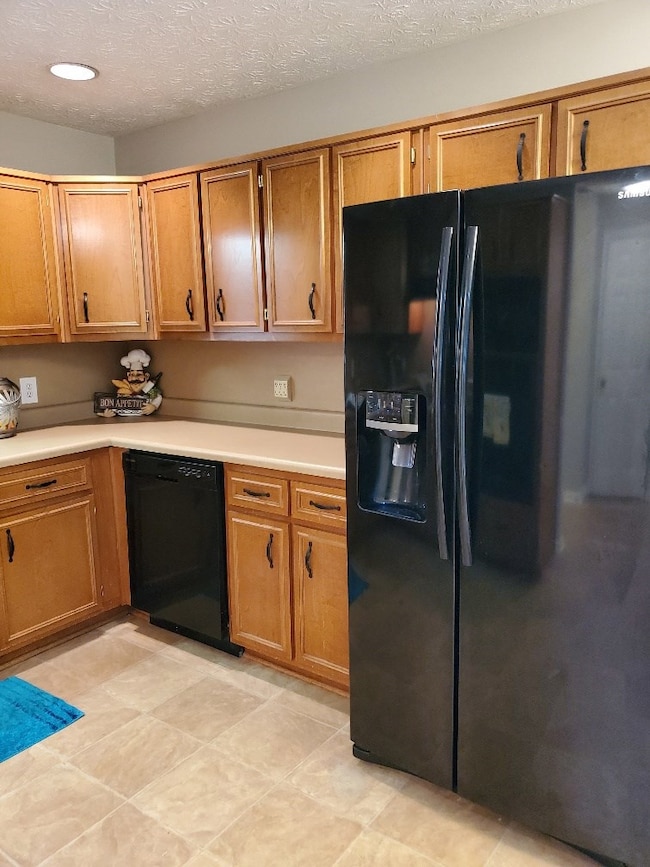
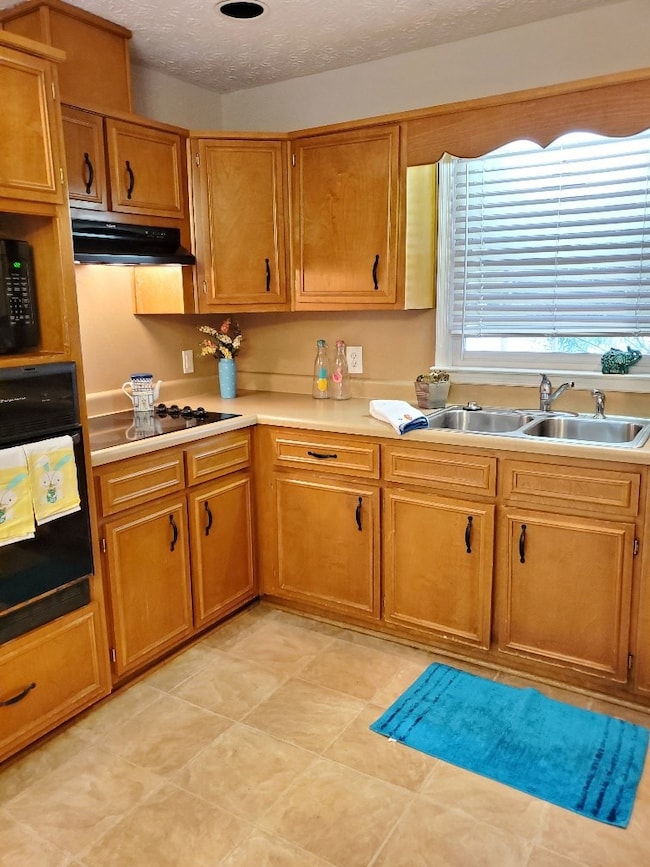
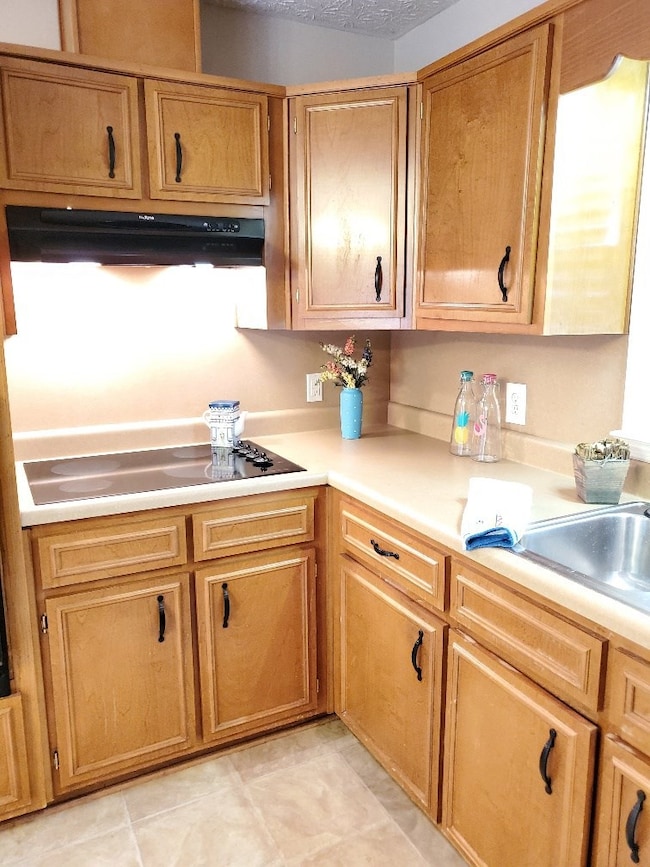
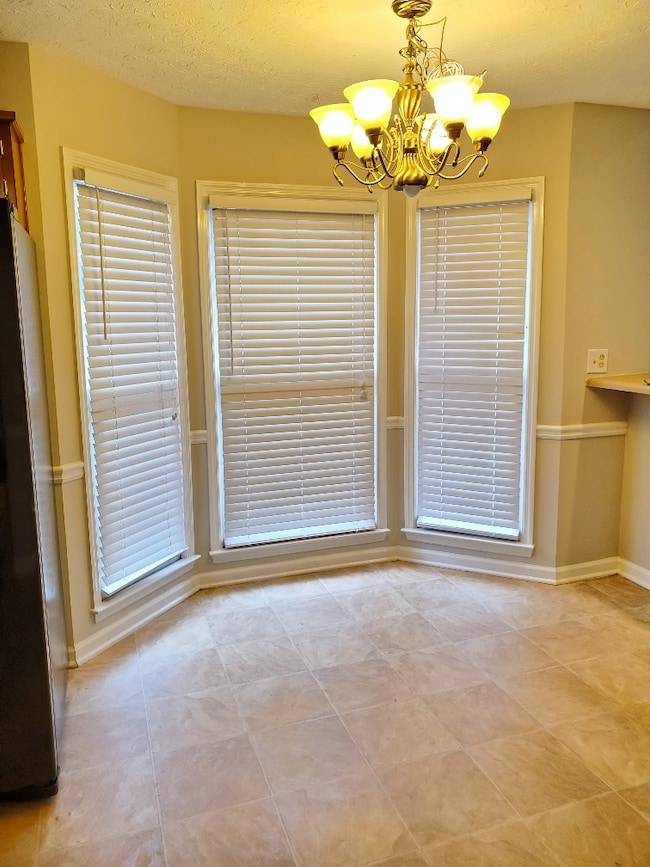
Welcome home! Large family room with high ceilings and electric fire place. Spacious kitchen has plenty of cabinet and counter space. Master bedroom is upstairs with a nice size bathroom with double vanities, jacuzzi tub and separate shower. Laundry room and large pantry room along with 2 bedrooms and a full bath are located on main floor. New interior paint, new carpet in family room. Screen porch is perfect for morning coffee or glass of wine in evenings. Neighborhood pool, club house and fishing pond. HOA is $50/monthly and can be paid annually, month or quarterly.
Last Agent to Sell the Property
Waddell Haskin & Green Realty, LLC Brokerage Phone: 7062213451 License #291111 Listed on: 03/20/2022
| Date | Buyer | Sale Price | Title Company |
|---|---|---|---|
| Dowers Wendell C | $162,500 | -- | |
| Dixon Rebecca J | $159,900 | None Available |
| Date | Status | Borrower | Loan Amount |
|---|---|---|---|
| Open | Dowers Wendell C | $146,800 | |
| Previous Owner | Dixon Rebecca J | $79,500 |
| Date | Event | Price | List to Sale | Price per Sq Ft |
|---|---|---|---|---|
| 04/27/2022 04/27/22 | Sold | $200,000 | -- | $115 / Sq Ft |
| 03/20/2022 03/20/22 | Pending | -- | -- | -- |
| Year | Tax Paid | Tax Assessment Tax Assessment Total Assessment is a certain percentage of the fair market value that is determined by local assessors to be the total taxable value of land and additions on the property. | Land | Improvement |
|---|---|---|---|---|
| 2025 | $3,088 | $78,880 | $9,476 | $69,404 |
| 2024 | $3,088 | $78,880 | $9,476 | $69,404 |
| 2023 | $3,107 | $78,880 | $9,476 | $69,404 |
| 2022 | $2,643 | $64,724 | $9,476 | $55,248 |
| 2021 | $2,255 | $55,228 | $9,476 | $45,752 |
| 2020 | $2,256 | $55,228 | $9,476 | $45,752 |
| 2019 | $2,263 | $55,228 | $9,476 | $45,752 |
| 2018 | $2,263 | $55,228 | $9,476 | $45,752 |
| 2017 | $2,270 | $55,228 | $9,476 | $45,752 |
| 2016 | $2,535 | $61,447 | $5,335 | $56,112 |
| 2015 | $2,538 | $61,447 | $5,335 | $56,112 |
| 2014 | $2,541 | $61,447 | $5,335 | $56,112 |
| 2013 | -- | $61,447 | $5,335 | $56,112 |
Seller's Agent in 2022
Nile Altman
Waddell Haskin & Green Realty, LLC
(706) 315-2995
14 in this area
73 Total Sales
B
Buyer's Agent in 2022
Bob Haskin
Haskin Realty Group, LLC
(706) 604-8484
37 in this area
147 Total Sales
Source: Columbus Board of REALTORS® (GA)
MLS Number: 191490
APN: 101-001-069
Disclaimer: Certain information contained herein is derived from information provided by parties other than Homes.com. All information provided is deemed reliable, but is not guaranteed to be accurate and should be independently verified.
![]() IDX information is provided exclusively for personal, non-commercial use, and may not be used for any purpose other than to identify prospective properties consumers may be interested in purchasing. Information is deemed reliable but not guaranteed.
IDX information is provided exclusively for personal, non-commercial use, and may not be used for any purpose other than to identify prospective properties consumers may be interested in purchasing. Information is deemed reliable but not guaranteed.