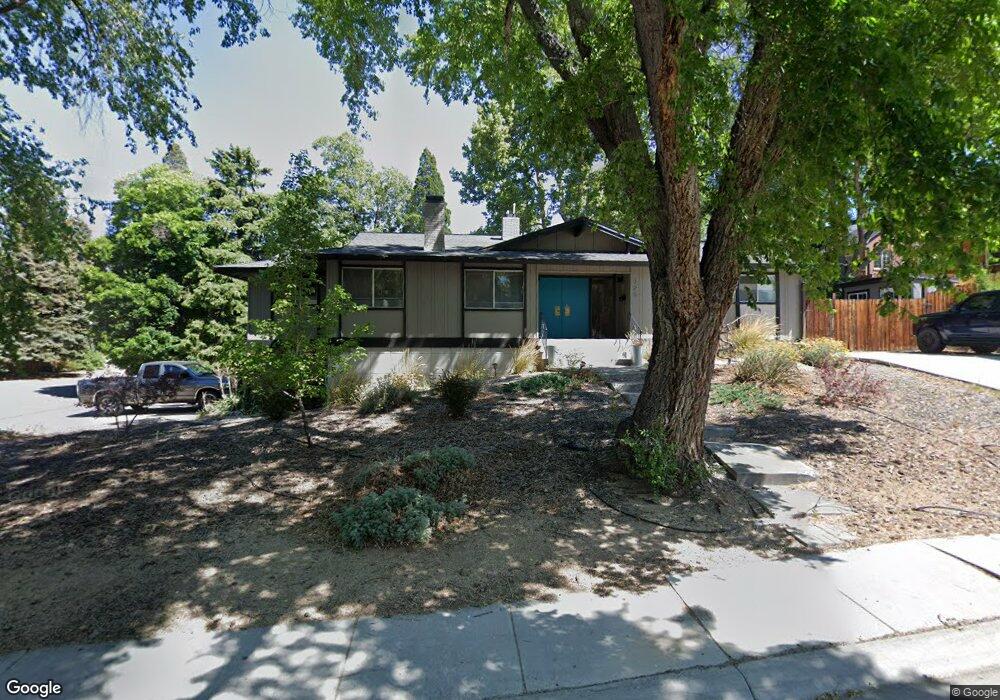
725 University Terrace Reno, NV 89503
West University NeighborhoodEstimated Value: $542,267 - $654,000
3
Beds
2
Baths
1,830
Sq Ft
$319/Sq Ft
Est. Value
About This Home
This home is located at 725 University Terrace, Reno, NV 89503 and is currently estimated at $584,567, approximately $319 per square foot. 725 University Terrace is a home located in Washoe County with nearby schools including Peavine Elementary School, Archie Clayton Pre-AP Academy, and Reno High School.
Ownership History
Date
Name
Owned For
Owner Type
Purchase Details
Closed on
Apr 21, 2023
Sold by
Unknown
Bought by
Russell Lacey
Current Estimated Value
Purchase Details
Closed on
Aug 19, 2008
Sold by
Haddan James P and Haddan Diane E
Bought by
Lacey Hoffman Luke C and Lacey Russell
Home Financials for this Owner
Home Financials are based on the most recent Mortgage that was taken out on this home.
Original Mortgage
$216,800
Interest Rate
6.37%
Mortgage Type
Unknown
Purchase Details
Closed on
Mar 12, 2006
Sold by
Haddan Dawn M
Bought by
Haddan James P and Haddan Diane E
Purchase Details
Closed on
Feb 23, 1998
Sold by
Savage Jean
Bought by
Savage Jean and Jean Savage Family Trust
Purchase Details
Closed on
Oct 6, 1997
Sold by
Savage Jean and Savage Wayne
Bought by
Savage Jean
Create a Home Valuation Report for This Property
The Home Valuation Report is an in-depth analysis detailing your home's value as well as a comparison with similar homes in the area
Home Values in the Area
Average Home Value in this Area
Purchase History
| Date | Buyer | Sale Price | Title Company |
|---|---|---|---|
| Russell Lacey | -- | None Listed On Document | |
| Lacey Hoffman Luke C | $271,000 | Ticor Title Reno | |
| Martens Dawn Haddan | -- | Ticor Title Reno | |
| Haddan James P | $42,500 | None Available | |
| Savage Jean | -- | -- | |
| Savage Jean | -- | -- |
Source: Public Records
Mortgage History
| Date | Status | Borrower | Loan Amount |
|---|---|---|---|
| Previous Owner | Lacey Hoffman Luke C | $216,800 |
Source: Public Records
Tax History Compared to Growth
Tax History
| Year | Tax Paid | Tax Assessment Tax Assessment Total Assessment is a certain percentage of the fair market value that is determined by local assessors to be the total taxable value of land and additions on the property. | Land | Improvement |
|---|---|---|---|---|
| 2025 | $1,220 | $70,894 | $41,545 | $29,349 |
| 2024 | $1,220 | $70,115 | $41,195 | $28,920 |
| 2023 | $1,129 | $66,804 | $40,005 | $26,800 |
| 2022 | $1,097 | $53,347 | $31,500 | $21,847 |
| 2021 | $1,063 | $42,777 | $21,490 | $21,287 |
| 2020 | $1,028 | $41,903 | $21,000 | $20,903 |
| 2019 | $999 | $40,765 | $21,000 | $19,765 |
| 2018 | $970 | $33,834 | $14,875 | $18,959 |
| 2017 | $942 | $31,304 | $12,705 | $18,599 |
| 2016 | $918 | $31,194 | $12,600 | $18,594 |
| 2015 | $916 | $27,718 | $9,450 | $18,268 |
| 2014 | $890 | $25,193 | $7,980 | $17,213 |
| 2013 | -- | $23,489 | $5,880 | $17,609 |
Source: Public Records
Map
Nearby Homes
- 90/100 Arden Cir
- 960 Ralston St
- 850 W 11th St
- 1217 Keystone Ave
- 840 Brookfield Dr
- 1130 Bon Rea Way
- 1275 Washington St
- 1035 N Sierra St
- 1415 Kings Row
- 1510 Majestic Dr Unit one
- 450 N Arlington Ave Unit N516
- 450 N Arlington Ave Unit 1009
- 450 N Arlington Ave Unit 1207
- 450 N Arlington Ave Unit 102
- 450 N Arlington Ave Unit 1403
- 450 N Arlington Ave Unit 708
- 450 N Arlington Ave Unit 701
- 450 N Arlington Ave Unit 507
- 1375 Wesley Dr
- 1600 Majestic Dr
- 804 Whitaker Dr
- 801 Washington St
- 801 Washington St Unit A
- 801 Washington St Unit B
- 811 Washington St
- 827 Washington St Unit A
- 827 Washington St
- 803 Whitaker Dr
- 810 Whitaker Dr
- 710 University Terrace
- 112 Whitaker Way
- 797 Washington St
- 10687 Washington St
- 10668 Washington St
- 10627 Washington St
- 10674 Washington St
- 10591 Washington St
- 10602 Washington St
- 10638 Washington St
- 10596 Washington St