Estimated Value: $470,593 - $503,000
3
Beds
2
Baths
1,300
Sq Ft
$379/Sq Ft
Est. Value
About This Home
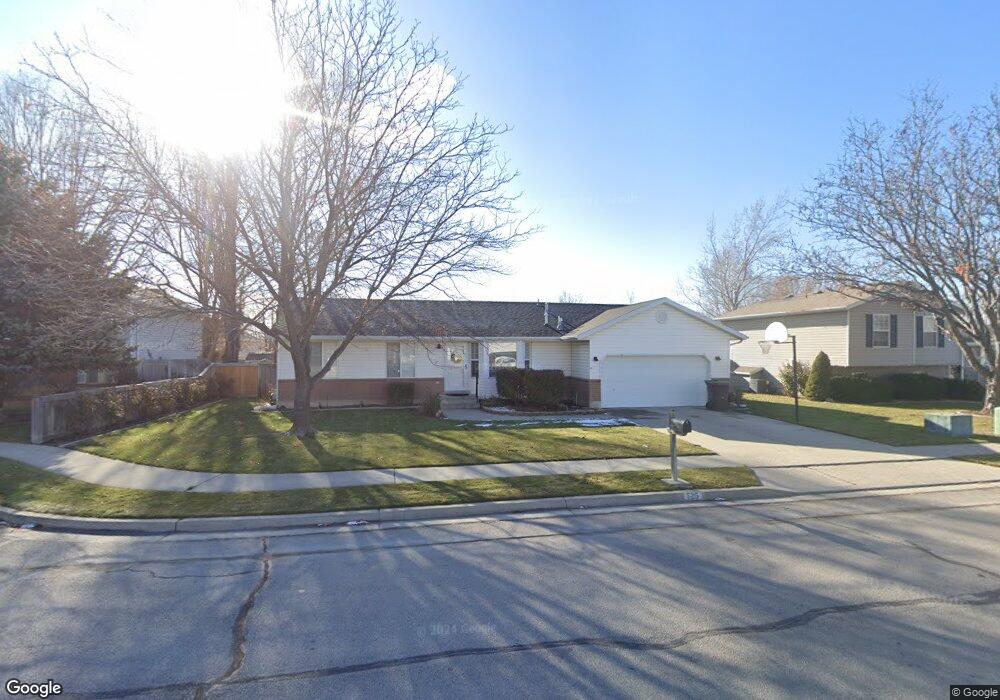
This home is located at 725 W 575 S, Lehi, UT 84043 and is currently estimated at $492,898, approximately $379 per square foot. 725 W 575 S is a home located in Utah County with nearby schools including Meadow Elementary School, Lehi Junior High School, and Lehi High School.
Ownership History
Date
Name
Owned For
Owner Type
Purchase Details
Closed on
Sep 30, 2019
Sold by
Pyper Scott J and Pyper Vicky L
Bought by
Pyper Scott J and Pyper Vicky L
Current Estimated Value
Purchase Details
Closed on
Jan 6, 2009
Sold by
Kent Gregory Alan and Kent Blair Madison
Bought by
Pyper Scott J and Pyper Vicky L
Home Financials for this Owner
Home Financials are based on the most recent Mortgage that was taken out on this home.
Original Mortgage
$158,500
Outstanding Balance
$104,334
Interest Rate
5.97%
Mortgage Type
Purchase Money Mortgage
Estimated Equity
$388,564
Purchase Details
Closed on
Feb 20, 2008
Sold by
Kent Lee and Kent Leatrice P
Bought by
Kent Lee
Purchase Details
Closed on
Nov 4, 1996
Sold by
Patterson Construction Inc
Bought by
Kent Lee and Kent Leatrice P
Home Financials for this Owner
Home Financials are based on the most recent Mortgage that was taken out on this home.
Original Mortgage
$75,000
Interest Rate
8.11%
Create a Home Valuation Report for This Property
The Home Valuation Report is an in-depth analysis detailing your home's value as well as a comparison with similar homes in the area
Home Values in the Area
Average Home Value in this Area
Purchase History
| Date | Buyer | Sale Price | Title Company |
|---|---|---|---|
| Pyper Scott J | -- | None Available | |
| Pyper Scott J | -- | Empire Land Title Company | |
| Kent Lee | -- | None Available | |
| Kent Lee | -- | First American |
Source: Public Records
Mortgage History
| Date | Status | Borrower | Loan Amount |
|---|---|---|---|
| Open | Pyper Scott J | $158,500 | |
| Previous Owner | Kent Lee | $75,000 |
Source: Public Records
Tax History Compared to Growth
Tax History
| Year | Tax Paid | Tax Assessment Tax Assessment Total Assessment is a certain percentage of the fair market value that is determined by local assessors to be the total taxable value of land and additions on the property. | Land | Improvement |
|---|---|---|---|---|
| 2025 | $1,868 | $228,030 | $181,000 | $233,600 |
| 2024 | $1,868 | $218,625 | $0 | $0 |
| 2023 | $1,774 | $225,445 | $0 | $0 |
| 2022 | $1,801 | $221,815 | $0 | $0 |
| 2021 | $1,594 | $296,800 | $104,800 | $192,000 |
| 2020 | $1,502 | $276,400 | $97,000 | $179,400 |
| 2019 | $1,322 | $253,000 | $97,000 | $156,000 |
| 2018 | $1,305 | $236,100 | $92,000 | $144,100 |
| 2017 | $1,235 | $118,800 | $0 | $0 |
| 2016 | $1,273 | $113,630 | $0 | $0 |
| 2015 | $1,241 | $105,160 | $0 | $0 |
| 2014 | $1,162 | $97,845 | $0 | $0 |
Source: Public Records
Map
Nearby Homes