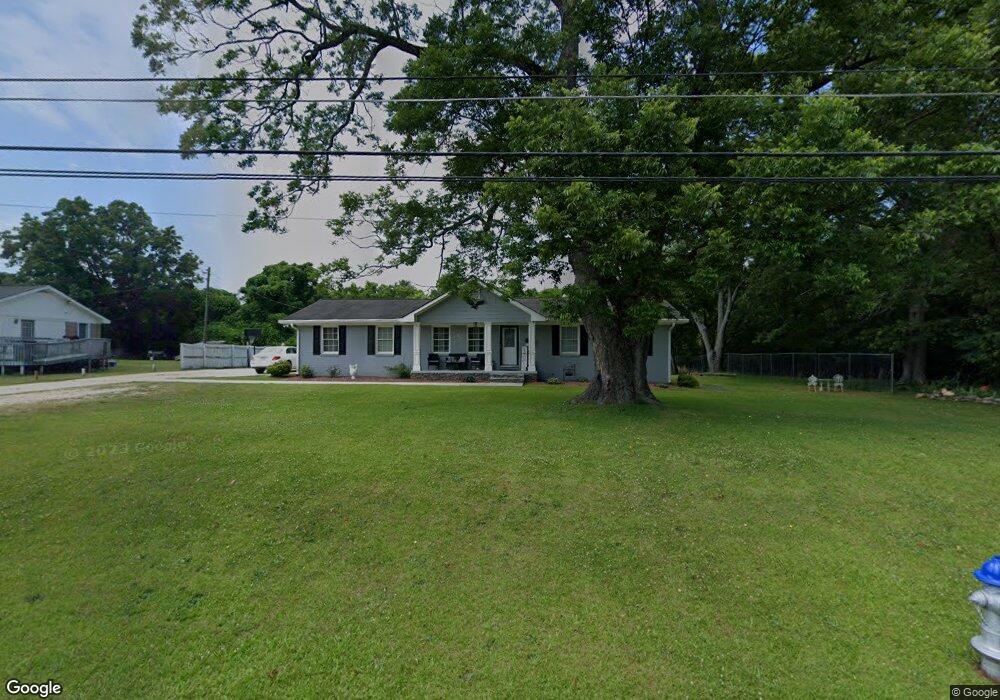
725 W Hightower Trail Social Circle, GA 30025
Estimated Value: $278,000 - $331,000
4
Beds
2
Baths
2,067
Sq Ft
$147/Sq Ft
Est. Value
About This Home
This home is located at 725 W Hightower Trail, Social Circle, GA 30025 and is currently estimated at $304,325, approximately $147 per square foot. 725 W Hightower Trail is a home located in Walton County with nearby schools including Social Circle Primary School, Social Circle Elementary School, and Social Circle Middle School.
Ownership History
Date
Name
Owned For
Owner Type
Purchase Details
Closed on
May 9, 2024
Sold by
Andrews Jarvis R
Bought by
Andrews Jarvis R and Andrews Victoria H
Current Estimated Value
Purchase Details
Closed on
Nov 24, 2009
Sold by
Yang Tong
Bought by
Andrews Jarvis R
Home Financials for this Owner
Home Financials are based on the most recent Mortgage that was taken out on this home.
Original Mortgage
$94,548
Interest Rate
4.94%
Mortgage Type
New Conventional
Purchase Details
Closed on
Nov 7, 2005
Sold by
Fannie Mae
Bought by
Yang Tong
Home Financials for this Owner
Home Financials are based on the most recent Mortgage that was taken out on this home.
Original Mortgage
$79,900
Interest Rate
6.22%
Mortgage Type
New Conventional
Purchase Details
Closed on
Jun 7, 2005
Sold by
Chase Hm Fin Llc
Bought by
Fedl Natl Mtg Assn
Create a Home Valuation Report for This Property
The Home Valuation Report is an in-depth analysis detailing your home's value as well as a comparison with similar homes in the area
Home Values in the Area
Average Home Value in this Area
Purchase History
| Date | Buyer | Sale Price | Title Company |
|---|---|---|---|
| Andrews Jarvis R | -- | -- | |
| Andrews Jarvis R | $89,900 | -- | |
| Yang Tong | -- | -- | |
| Fedl Natl Mtg Assn | -- | -- | |
| Chase Hm Fin Llc | $120,708 | -- |
Source: Public Records
Mortgage History
| Date | Status | Borrower | Loan Amount |
|---|---|---|---|
| Previous Owner | Andrews Jarvis R | $94,548 | |
| Previous Owner | Yang Tong | $79,900 |
Source: Public Records
Tax History Compared to Growth
Tax History
| Year | Tax Paid | Tax Assessment Tax Assessment Total Assessment is a certain percentage of the fair market value that is determined by local assessors to be the total taxable value of land and additions on the property. | Land | Improvement |
|---|---|---|---|---|
| 2024 | -- | $79,080 | $16,000 | $63,080 |
| 2023 | $0 | $75,640 | $14,400 | $61,240 |
| 2022 | $258,238 | $67,080 | $12,800 | $54,280 |
| 2021 | $418 | $58,240 | $8,800 | $49,440 |
| 2020 | $429 | $55,880 | $6,800 | $49,080 |
| 2019 | $438 | $47,480 | $6,800 | $40,680 |
| 2018 | $438 | $47,480 | $6,800 | $40,680 |
| 2017 | $1,763 | $42,200 | $5,200 | $37,000 |
| 2016 | $392 | $38,640 | $5,200 | $33,440 |
| 2015 | $333 | $33,640 | $5,200 | $28,440 |
| 2014 | $294 | $28,720 | $5,200 | $23,520 |
Source: Public Records
Map
Nearby Homes
- 355 Conner Ct
- 443 Windsong Ln
- 226 Rogue Rd
- 2049 Emily Dr
- 433 Clover Dr
- 215 Park Place Trail
- 1244 Morrow Dr
- 318 Richmond Dr
- 210 Park Place Trail
- 357 W Hightower Trail
- 967 Park Place St
- 413 Crossroads Dr
- The Trenton Plan at Town Park
- The Scottsdale Plan at Town Park
- 939 Park Place St
- 159 S Forest Ave
- 381 Crossroads Dr
- 1007 Towne Cir
- 695 Park Place Way
- 690 Park Place Way
- 717 W Hightower Trail
- 720 W Hightower Trail
- 701 W Hightower Trail
- 730 W Hightower Trail
- 740 W Hightower Trail
- 740 W Hightower Trail Unit 39
- 702 W Hightower Trail
- 750 W Hightower Trail
- 685 W Hightower Trail
- 686 W Hightower Trail
- 531 Cowpens Rd
- 0 W Hightower Trail Unit 5 acres 8318475
- 0 W Hightower Trail Unit 6015517
- 0 W Hightower Trail Unit 6015493
- 0 W Hightower Trail Unit 8318448
- 0 W Hightower Trail Unit 7126171
- 0 W Hightower Trail Unit 9052570
- 680 W Hightower Trail
- 527 Cowpens Rd
- 661 W Hightower Trail