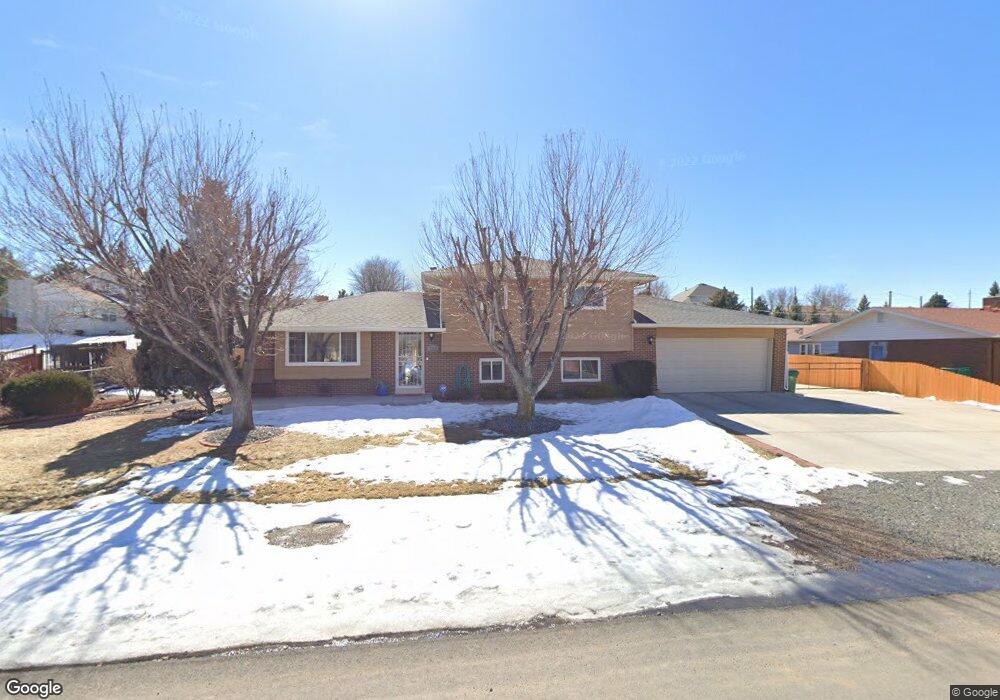
7250 W 95th Ave Westminster, CO 80021
Westcliff & Cambridge NeighborhoodEstimated Value: $648,535 - $791,000
3
Beds
5
Baths
1,232
Sq Ft
$570/Sq Ft
Est. Value
About This Home
This home is located at 7250 W 95th Ave, Westminster, CO 80021 and is currently estimated at $702,134, approximately $569 per square foot. 7250 W 95th Ave is a home located in Jefferson County with nearby schools including Semper Elementary School, Mandalay Middle School, and Standley Lake High School.
Ownership History
Date
Name
Owned For
Owner Type
Purchase Details
Closed on
Jan 12, 2015
Sold by
Noell Josef
Bought by
Noell David Josef and Noell Leigh Ann
Current Estimated Value
Home Financials for this Owner
Home Financials are based on the most recent Mortgage that was taken out on this home.
Original Mortgage
$265,000
Outstanding Balance
$93,485
Interest Rate
4.01%
Mortgage Type
Seller Take Back
Estimated Equity
$608,649
Purchase Details
Closed on
Mar 30, 2009
Sold by
Noell Josef and Noell David Josef
Bought by
Noell Josef
Purchase Details
Closed on
Oct 14, 2008
Sold by
Noell David Josef
Bought by
Noell Josef
Purchase Details
Closed on
Jan 28, 2005
Sold by
Bair Janet Mary
Bought by
Noell David Josef
Purchase Details
Closed on
Jul 6, 1999
Sold by
Noell David Josef
Bought by
Bair Janet Mary
Purchase Details
Closed on
Dec 13, 1995
Sold by
Noell Josef and Noell Christine
Bought by
Noell David Josef and Bair Janet Mary
Create a Home Valuation Report for This Property
The Home Valuation Report is an in-depth analysis detailing your home's value as well as a comparison with similar homes in the area
Home Values in the Area
Average Home Value in this Area
Purchase History
| Date | Buyer | Sale Price | Title Company |
|---|---|---|---|
| Noell David Josef | -- | None Available | |
| Noell Josef | -- | None Available | |
| Noell Josef | -- | None Available | |
| Noell David Josef | -- | -- | |
| Bair Janet Mary | -- | -- | |
| Noell David Josef | -- | -- |
Source: Public Records
Mortgage History
| Date | Status | Borrower | Loan Amount |
|---|---|---|---|
| Open | Noell David Josef | $265,000 |
Source: Public Records
Tax History Compared to Growth
Tax History
| Year | Tax Paid | Tax Assessment Tax Assessment Total Assessment is a certain percentage of the fair market value that is determined by local assessors to be the total taxable value of land and additions on the property. | Land | Improvement |
|---|---|---|---|---|
| 2024 | $4,246 | $45,109 | $23,974 | $21,135 |
| 2023 | $4,246 | $45,109 | $23,974 | $21,135 |
| 2022 | $3,641 | $37,856 | $17,449 | $20,407 |
| 2021 | $3,690 | $38,945 | $17,951 | $20,994 |
| 2020 | $3,092 | $32,649 | $12,906 | $19,743 |
| 2019 | $3,042 | $32,649 | $12,906 | $19,743 |
| 2018 | $3,119 | $32,383 | $11,232 | $21,151 |
| 2017 | $2,850 | $32,383 | $11,232 | $21,151 |
| 2016 | $2,390 | $25,470 | $9,224 | $16,246 |
| 2015 | $1,174 | $25,470 | $9,224 | $16,246 |
| 2014 | $1,174 | $19,677 | $8,135 | $11,542 |
Source: Public Records
Map
Nearby Homes
- 9495 Webster Way
- 9281 Upham Way
- 7423 W 93rd Place
- 9251 Wadsworth Blvd
- 9405 Otis St
- 6598 W 96th Dr
- 6563 W 96th Place
- 6620 W 95th Place
- 6794 W 98th Cir
- 6401 W 95th Ave
- 6317 W 95th Ave
- 6319 W 95th Ave
- 9657 Kendall Ct
- 9863 Zephyr Dr
- 9195 Pierce St Unit 1
- 9195 Pierce St Unit 3
- The Vue Plan at Greenlawn Towns
- 9409 Brentwood St
- 10245 Wadsworth Blvd
- 6200 W 95th Ave
- 7280 W 95th Ave
- 9485 Teller St
- 9505 Teller St
- 7320 W 95th Ave
- 7281 W 95th Ave
- 7321 W 95th Ave
- 7255 W 94th Place
- 7350 W 95th Ave
- 9555 Teller St
- 7285 W 94th Place
- 9490 Teller St
- 9484 Teller St
- 7215 W 94th Place
- 7325 W 94th Place
- 9480 Teller St
- 7351 W 95th Ave
- 9575 Teller St
- 9470 Teller St
- 7380 W 95th Ave
- 7355 W 94th Place