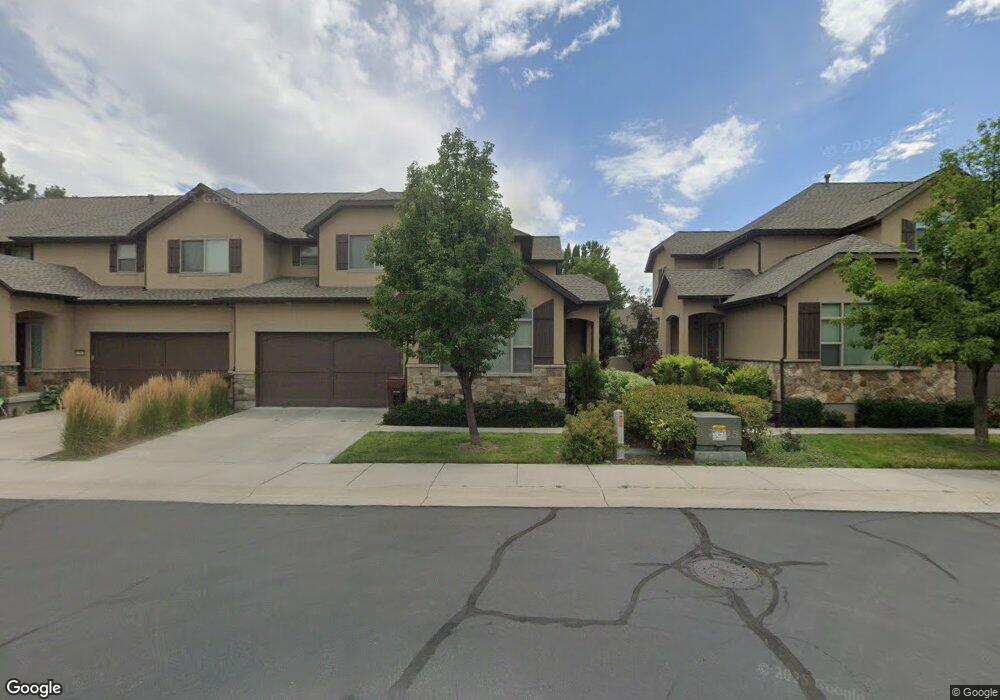
7252 S Viansa Ct Unit 8 Midvale, UT 84047
Estimated Value: $561,000 - $607,354
3
Beds
3
Baths
3,095
Sq Ft
$187/Sq Ft
Est. Value
About This Home
This home is located at 7252 S Viansa Ct Unit 8, Midvale, UT 84047 and is currently estimated at $580,089, approximately $187 per square foot. 7252 S Viansa Ct Unit 8 is a home located in Salt Lake County with nearby schools including Midvalley Elementary School, Hillcrest High School, and Midvale Middle School.
Ownership History
Date
Name
Owned For
Owner Type
Purchase Details
Closed on
Feb 21, 2020
Sold by
Fry Kevin Robet and Shumway Sarah
Bought by
Fry Kevin Robert
Current Estimated Value
Home Financials for this Owner
Home Financials are based on the most recent Mortgage that was taken out on this home.
Original Mortgage
$296,000
Outstanding Balance
$201,009
Interest Rate
3%
Mortgage Type
New Conventional
Estimated Equity
$379,080
Purchase Details
Closed on
May 9, 2019
Sold by
Fry Kevin Robert
Bought by
Fry Kevin Robert and Shumway Sarah
Home Financials for this Owner
Home Financials are based on the most recent Mortgage that was taken out on this home.
Original Mortgage
$304,800
Interest Rate
3.5%
Mortgage Type
New Conventional
Purchase Details
Closed on
May 18, 2016
Sold by
Viansa Villas Development Llc
Bought by
Fry Kevin Robert
Home Financials for this Owner
Home Financials are based on the most recent Mortgage that was taken out on this home.
Original Mortgage
$318,274
Interest Rate
3.59%
Mortgage Type
FHA
Create a Home Valuation Report for This Property
The Home Valuation Report is an in-depth analysis detailing your home's value as well as a comparison with similar homes in the area
Home Values in the Area
Average Home Value in this Area
Purchase History
| Date | Buyer | Sale Price | Title Company |
|---|---|---|---|
| Fry Kevin Robert | -- | Servicelink | |
| Fry Kevin Robert | -- | Monument Title Ins Co | |
| Fry Kevin Robert | -- | Metro National Title |
Source: Public Records
Mortgage History
| Date | Status | Borrower | Loan Amount |
|---|---|---|---|
| Open | Fry Kevin Robert | $296,000 | |
| Closed | Fry Kevin Robert | $304,800 | |
| Closed | Fry Kevin Robert | $318,274 |
Source: Public Records
Tax History Compared to Growth
Tax History
| Year | Tax Paid | Tax Assessment Tax Assessment Total Assessment is a certain percentage of the fair market value that is determined by local assessors to be the total taxable value of land and additions on the property. | Land | Improvement |
|---|---|---|---|---|
| 2025 | $3,473 | $599,800 | $65,600 | $534,200 |
| 2024 | $3,473 | $570,200 | $61,600 | $508,600 |
| 2023 | $3,572 | $581,100 | $58,500 | $522,600 |
| 2022 | $3,491 | $554,800 | $57,400 | $497,400 |
| 2021 | $3,159 | $429,300 | $57,400 | $371,900 |
| 2020 | $3,037 | $390,500 | $38,300 | $352,200 |
| 2019 | $2,864 | $358,800 | $36,200 | $322,600 |
| 2018 | $2,734 | $346,400 | $36,200 | $310,200 |
| 2017 | $2,663 | $324,300 | $36,200 | $288,100 |
| 2016 | $1,143 | $135,000 | $54,700 | $80,300 |
| 2015 | $857 | $54,700 | $54,700 | $0 |
| 2014 | $816 | $50,900 | $50,900 | $0 |
Source: Public Records
Map
Nearby Homes
- 7218 S Viansa Ct
- 7309 S Union Village Cir
- 7187 S 420 E
- 7170 S 420 E
- 239 E 7350 S
- 529 E 7215 S Unit 9
- 215 Carol Way
- 7080 S 230 E
- 7377 S Ramanee Dr
- 7436 S Launa St
- 550 E Villager Ln
- 210 Greenwood Ave Unit 102
- 5766 Sandy Woods Cir
- 7340 S 90 E
- 696 E Union Garden Ct
- 112 E 7420 S
- 7083 Village Place
- 7045 S 65 E
- 326 E 6815 S
- 618 E Cobblestone Ln
- 7246 S Viansa Ct Unit 7
- 7238 S Viansa Ct Unit 6
- 7256 S Viansa Ct Unit 9
- 7232 S Viansa Ct Unit 5
- 7232 S Viansa Ct
- 7260 S Viansa Ct Unit 10
- 7217 S Whitecrest Way
- 7241 S Viansa Ct Unit 48
- 7241 S Viansa Ct
- 7241 S Viansa Ct
- 7245 S 300 E Unit 7245
- 7266 S Viansa Ct
- 7266 S Viansa Ct Unit 11
- 7235 S Viansa Ct
- 7235 S Viansa Ct
- 7233 S Halelani Dr
- 7253 S Viansa Ct Unit 25
- 7253 S Viansa Ct
- 7229 S Viansa Ct
- 7222 S Viansa Ct