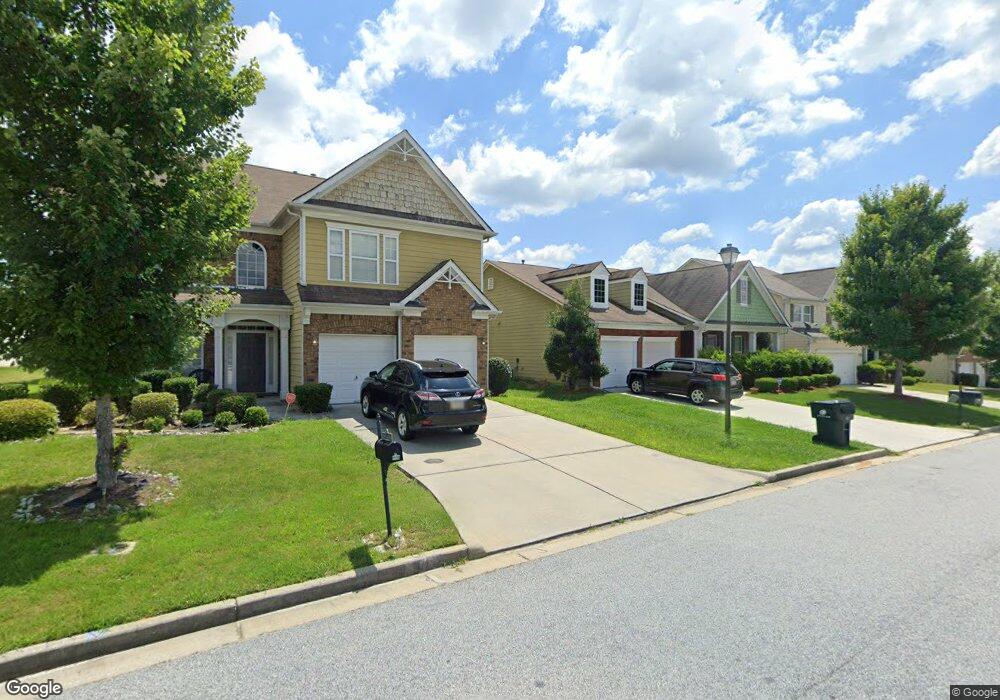
7252 Toccoa Cir Union City, GA 30291
Estimated Value: $287,000 - $319,000
3
Beds
2
Baths
1,866
Sq Ft
$161/Sq Ft
Est. Value
About This Home
This home is located at 7252 Toccoa Cir, Union City, GA 30291 and is currently estimated at $300,711, approximately $161 per square foot. 7252 Toccoa Cir is a home located in Fulton County with nearby schools including Oakley Elementary School, Bear Creek Middle School, and Creekside High School.
Ownership History
Date
Name
Owned For
Owner Type
Purchase Details
Closed on
Jan 22, 2019
Sold by
Mitchell Joseph J
Bought by
Mitchell Joseph H and Mitchell Evelyn
Current Estimated Value
Purchase Details
Closed on
Oct 27, 2017
Sold by
Montgomery Tim
Bought by
Mitchell Joseph H
Home Financials for this Owner
Home Financials are based on the most recent Mortgage that was taken out on this home.
Original Mortgage
$145,900
Interest Rate
3.83%
Mortgage Type
VA
Purchase Details
Closed on
Sep 30, 2009
Sold by
Citigroup Mtg Ln Trust Inc
Bought by
Montgomery Tim
Home Financials for this Owner
Home Financials are based on the most recent Mortgage that was taken out on this home.
Original Mortgage
$117,826
Interest Rate
5.1%
Mortgage Type
FHA
Purchase Details
Closed on
Apr 7, 2009
Sold by
Citigroup Inc Trust 2007 & 6
Bought by
Citigroup Inc Trust 2007 & 6
Create a Home Valuation Report for This Property
The Home Valuation Report is an in-depth analysis detailing your home's value as well as a comparison with similar homes in the area
Home Values in the Area
Average Home Value in this Area
Purchase History
| Date | Buyer | Sale Price | Title Company |
|---|---|---|---|
| Mitchell Joseph H | -- | -- | |
| Mitchell Joseph H | $145,900 | -- | |
| Montgomery Tim | $120,000 | -- | |
| Citigroup Inc Trust 2007 & 6 | $153,105 | -- |
Source: Public Records
Mortgage History
| Date | Status | Borrower | Loan Amount |
|---|---|---|---|
| Previous Owner | Mitchell Joseph H | $145,900 | |
| Previous Owner | Montgomery Tim | $117,826 |
Source: Public Records
Tax History Compared to Growth
Tax History
| Year | Tax Paid | Tax Assessment Tax Assessment Total Assessment is a certain percentage of the fair market value that is determined by local assessors to be the total taxable value of land and additions on the property. | Land | Improvement |
|---|---|---|---|---|
| 2025 | $911 | $113,160 | $38,680 | $74,480 |
| 2023 | $3,239 | $114,760 | $38,680 | $76,080 |
| 2022 | $857 | $69,360 | $11,160 | $58,200 |
| 2021 | $990 | $66,680 | $10,840 | $55,840 |
| 2020 | $977 | $65,840 | $10,680 | $55,160 |
| 2019 | $969 | $58,960 | $9,440 | $49,520 |
| 2018 | $956 | $54,000 | $9,240 | $44,760 |
| 2017 | $1,686 | $58,440 | $15,240 | $43,200 |
| 2016 | $1,684 | $58,440 | $15,240 | $43,200 |
| 2015 | $1,690 | $58,440 | $15,240 | $43,200 |
| 2014 | $1,481 | $52,080 | $11,880 | $40,200 |
Source: Public Records
Map
Nearby Homes
- 4230 Vinca Way
- 7317 Gossamer St
- 7367 Poppy Way
- 7366 Basalt Dr
- 7413 Melhana Ln
- 4305 Comfort Trail
- 4613 Irish Red Ct
- 380 Brannigan Ct
- 7259 Taloga Ln
- 4354 Favored Way
- 4661 Irish Red Ct
- 7695 Oakley Rd
- 7125 Woodridge Ln
- 7889 Winkman Dr
- 4401 Belcamp Rd
- 4425 Belcamp Rd
- 6338 Hickory Lane Cir
- 6340 Hickory Lane Cir
- 722 Keeshono St
- 7248 Toccoa Cir
- 7256 Toccoa Cir
- 721 Lavender Ln
- 7244 Toccoa Cir
- 7244 Toccoa Cir Unit 1
- 725 Lavender Ln
- 7260 Toccoa Cir
- 7255 Toccoa Cir
- 729 Lavender Ln
- 7247 Toccoa Cir
- 7240 Toccoa Cir
- 713 Lavender Ln
- 7263 Basalt Dr
- 7264 Toccoa Cir
- 7263 Toccoa Cir
- 7263 Toccoa Cir Unit 1
- 7285 Basalt Dr
- 7235 Toccoa Cir
- 0 Lavender Ln Unit 8682479
- 0 Lavender Ln Unit 7383259